
Descripción
El Perfil de Volumen Rígido divide su ventana de retroceso en un número fijo de niveles de precio y muestra cuánto volumen se negoció en cada uno, dividido en presión de compra y venta.
LO QUE DIBUJA
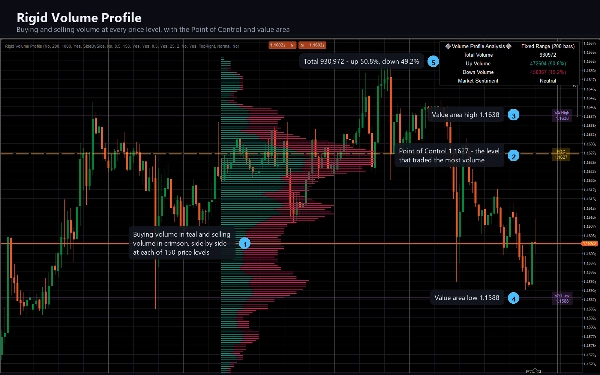
Un histograma horizontal junto a la acción del precio, construido a partir de las últimas N barras. La barra de cada nivel se divide en volumen alcista (de barras que cerraron al alza) y volumen bajista (de barras que cerraron a la baja), para que pueda ver no solo dónde ocurrió la negociación sino qué lado la estaba realizando. Las barras que cerraron sin cambios dividen su volumen equitativamente entre ambos.
Una línea discontinua de Punto de Control marca el nivel de precio que negoció el mayor volumen en la ventana, etiquetada con su precio exacto.
Dos líneas de área de valor delimitan los niveles que representan el 70% del volumen de la ventana, cada una etiquetada.
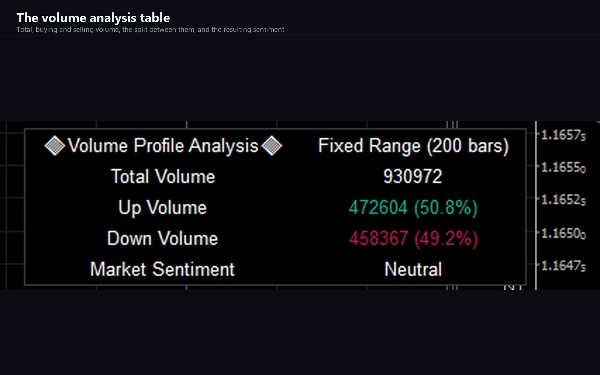
Una tabla de análisis de volumen informa el volumen total, al alza y a la baja con porcentajes, y una lectura de sentimiento basada en qué lado domina.
CÓMO USARLO
Los perfiles de volumen describen dónde ocurrió realmente la negociación, en lugar de dónde simplemente se movió el precio. Un nivel que absorbió mucho volumen es un nivel que a muchos participantes les importa; una parte del perfil delgada es un rango de precios por el que el mercado se movió rápidamente.
Lea el Punto de Control como el centro de gravedad de la ventana. Lea el área de valor como el rango donde se realizó la mayor parte del negocio. Lea un espacio delgado entre dos nodos pesados como una zona que el precio tiende a cruzar en lugar de permanecer. Observe qué lado de la división domina un nivel cuando el precio regresa a él.
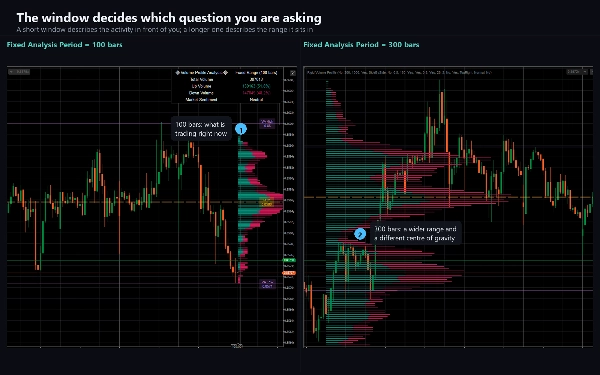
La ventana es su elección y la imagen cambia con ella, así que elija un retroceso que coincida con la decisión que está tomando. Un perfil de 100 barras responde a una pregunta diferente que uno de 500 barras.
CONFIGURACIONES CLAVE
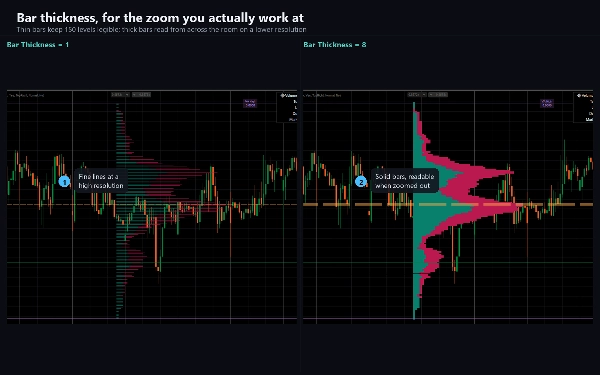
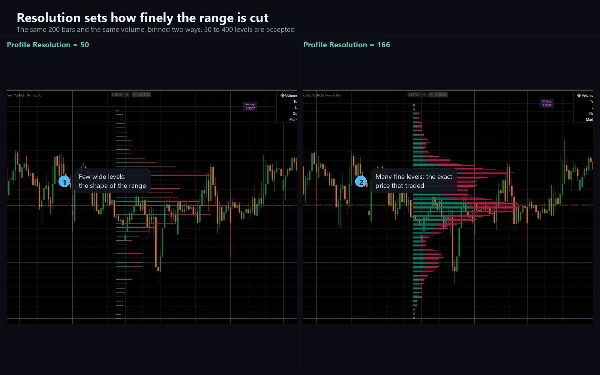
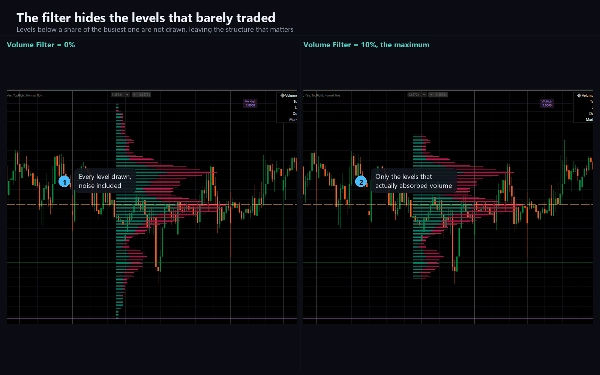
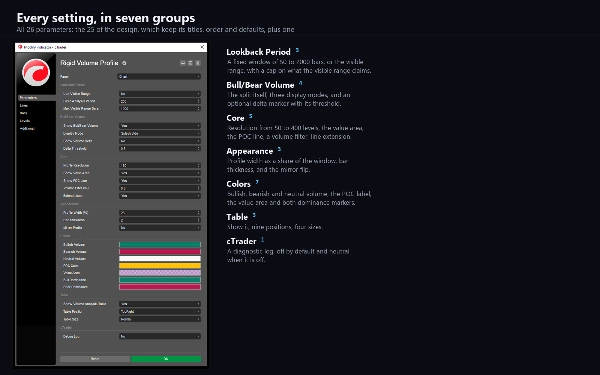
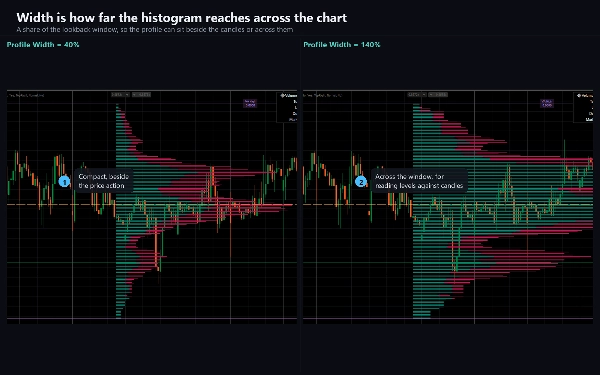
El Periodo de Análisis Fijo establece el retroceso en barras, de 50 a 2000. La Resolución del Perfil establece en cuántos niveles de precio se divide el rango, de 50 a 400; menos niveles se leen como un perfil clásico, más niveles ofrecen detalles finos. El Modo de Visualización ofrece Lado a Lado, Apilado y Dividido. El Ancho del Perfil escala el histograma como un porcentaje del retroceso. El Filtro de Volumen oculta niveles por debajo de un porcentaje del más ocupado. Mostrar Delta de Volumen añade un marcador donde un lado domina claramente. Cada color es ajustable, y la tabla de análisis puede moverse a cualquiera de las nueve posiciones o apagarse.
Usar Rango Visible cambia el retroceso a las barras actualmente en pantalla en lugar de un conteo fijo.
TIPO DE INDICADOR Y VENTANA
Superposición en gráfico. Se dibuja sobre el gráfico de precios mismo, no en un panel separado.
MARCO TEMPORAL E INSTRUMENTOS
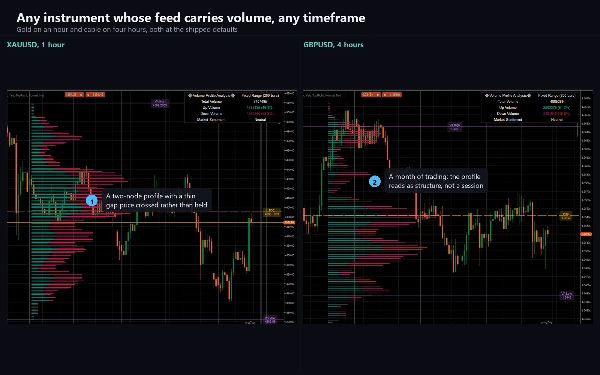
Cualquier marco temporal. Es más útil intradía, desde M5 a H4, donde la distribución del volumen de una sesión es un objeto significativo.
Funciona en cualquier instrumento cuyo feed incluya volumen. En forex eso es volumen de ticks, el número de actualizaciones de precio por barra, que es un proxy para la actividad más que para el tamaño negociado. En CFDs de índices y commodities algunos brokers suministran volumen real de intercambio, y el perfil es más significativo allí. En un instrumento sin volumen, no se dibuja nada.
PARA QUIÉN ES
Traders que ya trabajan con perfiles de volumen y quieren uno con una cuadrícula fija ajustable y una división explícita de compra y venta, en lugar de un perfil de sesión fijo.
PRUEBA
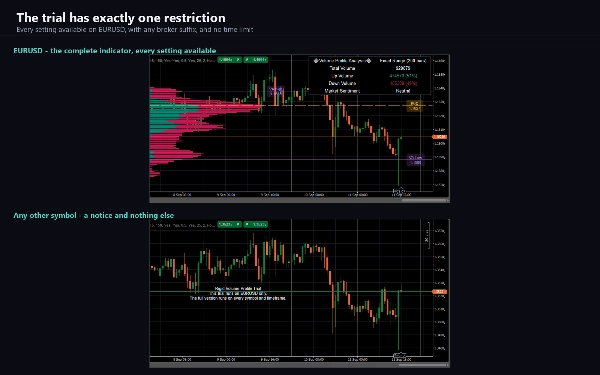
Se adjunta una edición de prueba a este producto. Es el indicador completo con todas las configuraciones disponibles, restringido a EURUSD. La versión completa elimina esa restricción y no añade nada más.
NOTAS TÉCNICAS Y LIMITACIONES
El perfil se recalcula en cada tick de la barra en formación, por lo que el Punto de Control y el área de valor se mueven dentro de una barra y se estabilizan cuando esta cierra. Esto es intencional. Nada aquí es una señal de barra cerrada.
Con una Resolución de Perfil superior a 166, los niveles de precio más bajos no se dibujan. Esto es un límite deliberado del diseño, que reserva un conjunto fijo de objetos de dibujo y usa tres por nivel de precio; los interruptores Mostrar Línea POC y Mostrar Área de Valor liberan cada uno uno. Mantenga la Resolución de Perfil en 166 o menos para ver el perfil completo.
El área de valor se construye clasificando los niveles por volumen y tomándolos en ese orden hasta alcanzar el 70%, luego reportando el precio más alto y más bajo entre ellos. Por lo tanto, suele ser más amplia que un área de valor construida caminando hacia afuera desde el Punto de Control.
Debido a que el perfil se construye a partir del volumen de su broker, dos brokers no producirán un perfil idéntico del mismo mercado.
AccessRights es Ninguno: el indicador no coloca órdenes, no modifica nada y no lee datos de cuenta.
SOPORTE
La documentación que cubre cada parámetro, las configuraciones que sorprenden a la gente y una guía de solución de problemas se incluyen con el producto. Las preguntas son bienvenidas a través de la pestaña de Discusión; un informe útil nombra el símbolo, broker, marco temporal, versión de cTrader y las configuraciones cambiadas del valor predeterminado.
El trading implica riesgos. El rendimiento pasado no garantiza resultados futuros.
Resumen
Users can customize the lookback period (50 to 2000 bars), profile resolution (50 to 400 levels), display mode (side by side, stacked, split), profile width, and volume filtering. The profile updates dynamically on every tick of the forming bar. It supports any timeframe and instruments with volume data, including tick volume for forex and real exchange volume for some CFDs. The indicator is intended for traders familiar with volume profiles seeking detailed buying and selling pressure insights on a fixed grid rather than session-based profiles. A trial version is available with full features restricted to EURUSD.