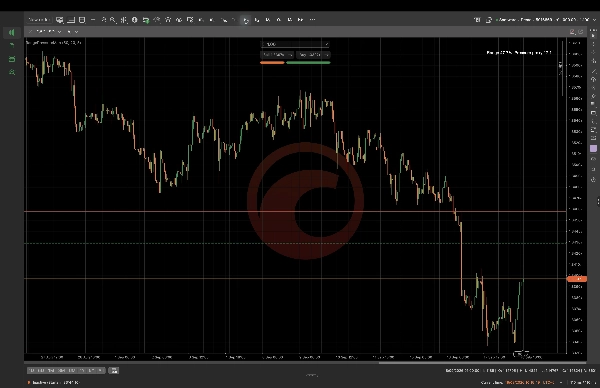
present
Daftar dan dapatkan diskon $50 untuk pembelian pertama Anda
Trading product for Range Pressure Map Indikator EMA Volume, image 1
Range Pressure Map
Indikator
Versi 1.0, Sep 2026
Windows, Mac
5.0
Ulasan: 2
Trading product for Range Pressure Map Indikator EMA Volume, image 2
Trading product for Range Pressure Map Indikator EMA Volume, image 3
Trading product for Range Pressure Map Indikator EMA Volume, image 4
Trading product for Range Pressure Map Indikator EMA Volume, image 5
Sejak 16/09/2026

Deskripsi

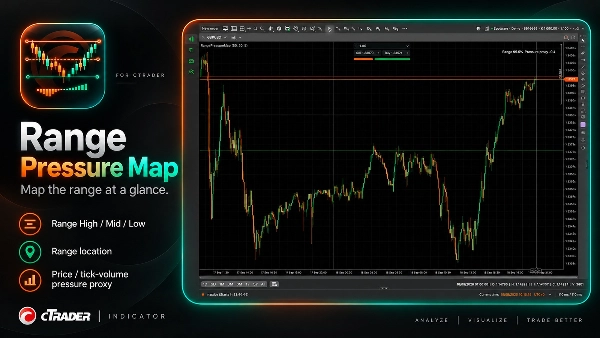
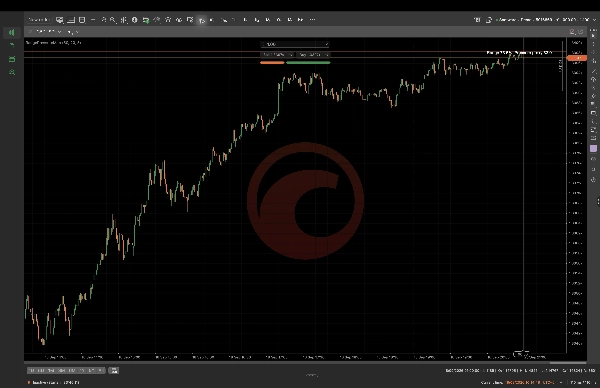
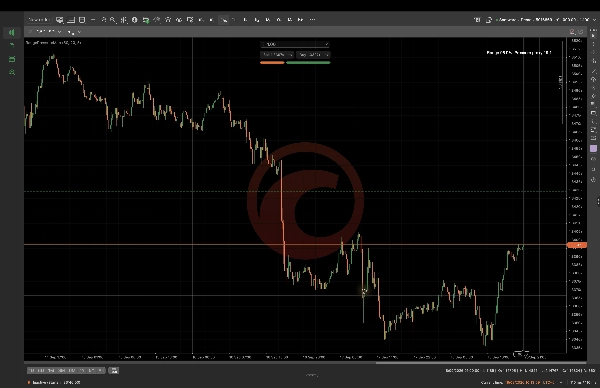
Peta Tekanan Rentang menghitung rentang tinjauan kembali dan menampilkan Rentang Tinggi, Rentang Tengah, dan Rentang Rendah bersama dengan lokasi harga saat ini dan proxy tekanan volume tick deterministik. Konfigurasikan tinjauan kembali rentang, tinjauan kembali tekanan, dan panjang EMA agar sesuai dengan konteks grafik yang Anda tinjau. Ini dirancang untuk analisis grafik diskresioner dan tidak mewakili aliran pesanan, volume pasar nyata, aktivitas pembeli atau penjual, prediksi, atau eksekusi perdagangan otomatis. Nilai bergantung pada simbol yang dipilih, kerangka waktu, parameter, dan data yang tersedia.

Ringkasan

Ringkasan AI
Range Pressure Map is a cTrader indicator that calculates a lookback range and visually displays the Range High, Range Mid, and Range Low levels on your chart. It also shows the current price location within this range alongside a deterministic tick-volume pressure proxy, which serves as an estimate of market pressure based on tick volume data. Users can customize parameters including range lookback period, pressure lookback, and EMA length to align with their specific chart context. This tool is intended for discretionary chart analysis and does not provide order flow data, real market volume, buyer or seller activity, predictive signals, or automated trade execution. Its outputs depend on the selected trading symbol, timeframe, and input parameters. The indicator supports visualization of support and resistance levels combined with volume-based pressure insights to assist traders in analyzing price action within defined ranges.
Profil indikator
Kategori indikator
Support & resistance
Tipe output
Visualisasi
Persyaratan data
Hanya batang

Diskusi

Ulasan pelanggan

5.0
Ulasan: 2
5
100 %
4
0 %
3
0 %
2
0 %
1
0 %
Ulasan pelanggan
October 20, 2026
Range Pressure Map provided a clean and consistent range view on EURUSD and XAUUSD across H1 and M1. High, Mid and Low levels were clearly plotted, while the displayed range percentage matched the visible price location well. The pressure proxy added context without cluttering the chart or being presented as true order flow. Score 4,7/5
October 7, 2026
A range high, midpoint and low put the pressure proxy in a clear setting. Lookback and EMA controls make the view adjustable, and the description is upfront about using tick volume rather than real buyer and seller flow. That honesty makes the map easier to interpret.

Pertanyaan umum

EMA
Volume
Produk-produk yang tersedia melalui cTrader Store, termasuk bot trading, indikator, dan plugin, disediakan oleh pengembang pihak ketiga serta hanya ditujukan untuk akses teknis dan informasi. cTrader Store bukan broker dan tidak menyediakan saran investasi, rekomendasi pribadi, atau jaminan apa pun tentang kinerja di masa mendatang.
Produk lain dari penulis ini

Logo "BOS CHOCH Structure"
Peringkat teratas
4.5
(4)
$29
/
$39
Indikator
BOS
MSS
+4
See confirmed BOS, CHOCH and SWEEP structure events on your cTrader chart.
Indikator
BOS
Add standard-timeframe context candles to a native Renko chart.
Indikator
Channel
Key Levels
+1
Monitor a selected chart trendline and confirm breaks on candle close.
Plugin desktop
Trade Journal
Trade Statistics
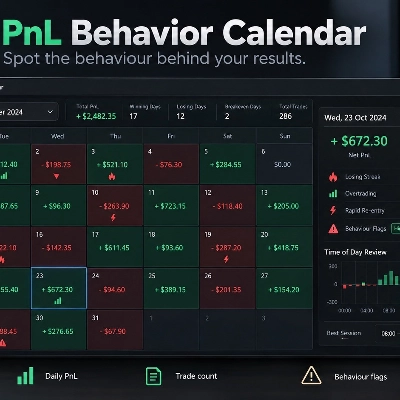
Review daily PnL, trade counts, losing streaks and rapid re-entry from your cTrader history.
Plugin desktop
Chart UI Tools
Keep lines, zones and channels synced across selected same-symbol charts from one desktop plugin.
cBot
Drawdown Guard
Daily Loss Limit
Monitor account-wide loss and stop-loss risk budgets, with optional order cancellation and post-fill closure.
Plugin desktop
Position Sizer
Risk Calculator
Size manual trades from your risk settings and review Market, Limit or Stop orders before execution.
Indikator
Volume
Key Levels
View tick activity across a selected chart range with Point of Control, Value Area High and Value Area Low.

Anda mungkin juga suka

Indikator
Aggressive
Supertrend
+5
Stop trading with tunnel vision! 🚫 The Heat Map Dashboard is an institutional-grade visual trading assistant
Indikator
Key Levels
Trend-filtered signals, transparent trade plans and a multi-timeframe decision panel for cTrader.
Indikator
Forex
Crypto
+5
📈 Initial Balance Breakout Signals: visually accurate IB levels, breakout alerts & forecast zones for smart trading.
Indikator
AI
Forex
+5
Dynamic, color‑coded candles reveal market shifts instantly—spot momentum and trend reversals at a glance
Indikator
VWAP
Volume
+5
Multi VWAP. Three timeframes. One clean chart. Your Essential Trading Tool.
Indikator
AI
ATR
+27
An advanced VWAP with multi-VWAP (Daily/Weekly/Monthly/Anchored), click-to-anchor, configurable alerts, a stats panel,
Indikator
ATR
Prop
+15
Initial Range – Where the open writes the script.
Indikator
ATR
Volume
+2
Nine timeframe cards, vivid candles, native BUY/SELL arrows and adjustable ATR-buffer stop-loss reference lines.
Indikator
Forex
EURUSD
+5
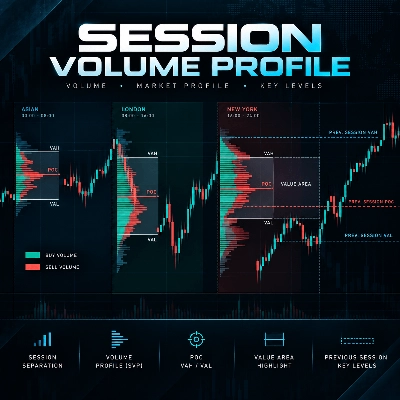
Session Volume Profile is a professional volume profile indicator for cTrader.
Indikator
ATR
BTCUSD
+5
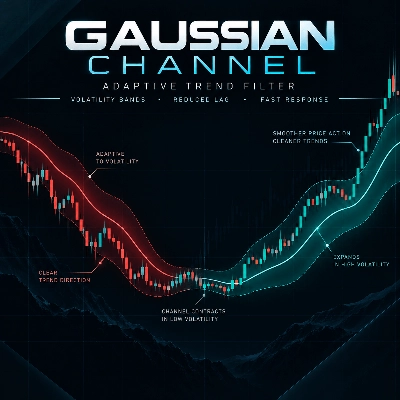
Multi-pole Gaussian filter channel with dynamic color, Reduced Lag & Fast Response modes. Port of DonovanWall's original
Indikator
SMA
Volume
+3
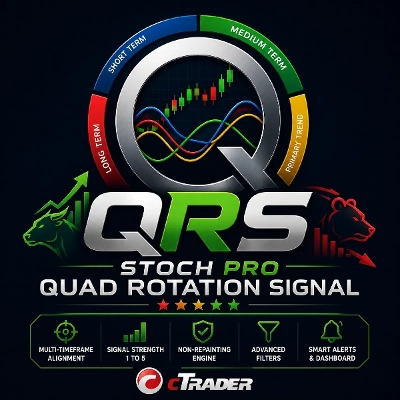
Stoc​h PRO Quad Rotation Signal (QRS) is an advanced technical analysis indicator developed for cTrader.
Indikator
Forex
Crypto
+6
The ultimate candlestick suite is here to help you detect most of the candlestick patters that exist today.
Indikator
Volume
Support & Resistance
Compare up to 27 symbols across eight timeframes with seven analysis engines and an interactive cTrader dashboard.
Indikator
EURUSD
GBPUSD
+3
All-in-one suite for ICT concepts: NY Midnight Open, Killzones, automatic Liquidity levels (PDH/L, PWH/L).
Indikator
Forex
Crypto
+5
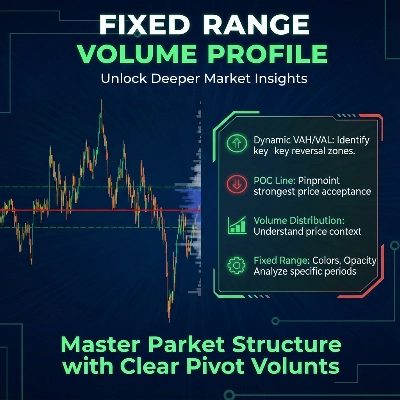
Fixed Range Volume Profile (FRVP) : analyzes price volume within a custom rectangle to find POC, VAH, and VAL.
Indikator
Prop
Forex
+4
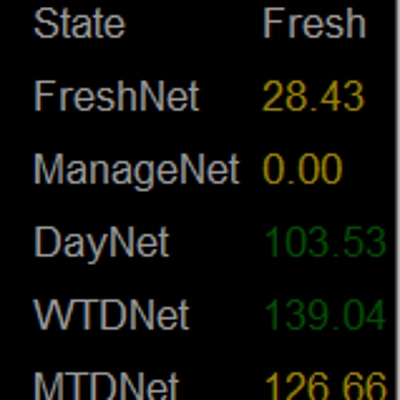
Personal trade tracker for a single symbol. Clear net profit summary — FreshNet, ManageNet, DayNet, WTDNet, MTDNet.
Indikator
Volume
Key Levels
View tick activity across a selected chart range with Point of Control, Value Area High and Value Area Low.
Indikator
SMC
VWAP
+16
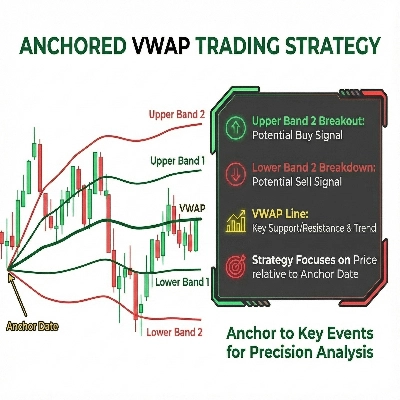
It calculates Anchored VWAP and StdDev bands from a user-defined start date for cTrader charts.

Harga

Sejak 16/09/2026