
Описание
Данный индикатор cAlgo, AutoPositionSizingRR, предназначен для помощи трейдерам в автоматическом расчёте и управлении размерами позиций на основе риска, уровней стоп-лосса и тейк-профита. Он настраиваемый и может применяться как на фондовом, так и на валютном рынках, предоставляя подробную информацию о торговой установке. Вот обзор его ключевых функций и возможностей:
Ключевые особенности:
- Определение размера позиции на основе риска: Рассчитывает оптимальный размер лота на основе указанной суммы риска и расстояния между ценой входа и стоп-лоссом.
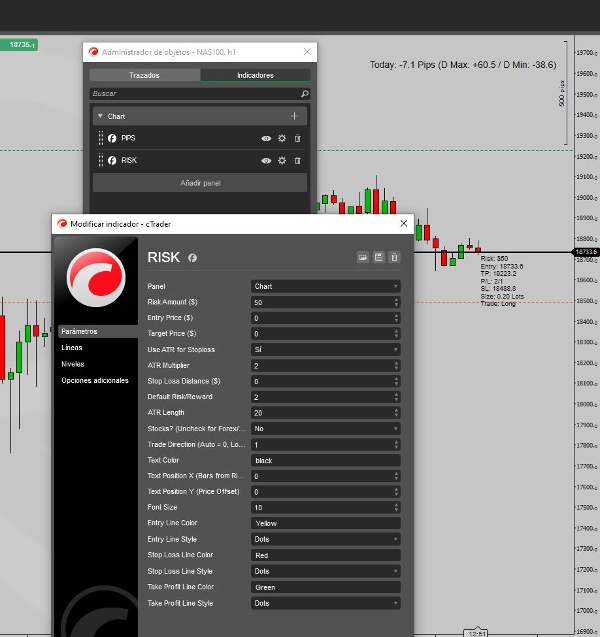
- Настраиваемые параметры: Пользователи могут задавать параметры, такие как сумма риска, цена входа, целевая цена, расстояние стоп-лосса, множитель ATR и другие, что позволяет адаптировать управление рисками.
- Динамический стоп-лосс и тейк-профит: Может рассчитывать стоп-лосс и тейк-профит на основе фиксированного расстояния, ATR (среднего истинного диапазона) или заданного соотношения риск/прибыль.
- Поддержка Forex и акций: Поддерживает как валютный, так и фондовый рынки, корректируя расчёты в зависимости от торгуемого инструмента.
- Визуальная настройка: Рисует горизонтальные линии на графике для входа, стоп-лосса и тейк-профита, обеспечивая удобное визуальное представление торговой установки. Также отображает ключевую информацию, такую как цена входа, стоп-лосс, тейк-профит, размер лота и тип сделки непосредственно на графике.
Как это работает:
- Входные данные: Пользователь задаёт сумму риска (в USD), цену входа, целевую цену и расстояние стоп-лосса (фиксированное или основанное на ATR). ATR (средний истинный диапазон) может использоваться для расчёта расстояния стоп-лосса на волатильных рынках.
- Расчёт: Скрипт автоматически рассчитывает размер позиции, деля сумму риска на расстояние стоп-лосса (в пунктах или в долларах, в зависимости от того, валютная это сделка или сделка с акциями).
- Информация о сделке: Отображает на графике информацию в реальном времени, такую как цена входа, стоп-лосс, тейк-профит и необходимый размер лота для поддержания заданного уровня риска.
Визуальные функции:
- Линии на графике: Рисует уровни входа, стоп-лосса и тейк-профита в виде горизонтальных линий на графике.
- Текстовый оверлей: Отображает отформатированные детали сделки (риск, вход, TP, SL, размер лота и т.д.) на графике с настраиваемым положением текста, цветом и размером шрифта.
Использование:
- Этот индикатор полезен для дейтрейдеров, свинг-трейдеров и скальперов, которые хотят автоматизировать процесс расчёта размеров позиций на основе заданного порога риска. Он упрощает управление сделками, предоставляя визуальные подсказки и информацию о сделке прямо на графике, что может привести к более эффективному принятию решений.
Пример:
- Трейдер может задать сумму риска в $50, цену входа $100 и использовать ATR для расчёта стоп-лосса. Скрипт рассчитает оптимальный размер позиции, нарисует уровни входа, стоп-лосса и тейк-профита на графике и отобразит важные детали сделки, такие как сумма риска, стоп-лосс и потенциальная прибыль.
Этот инструмент идеально подходит для трейдеров, которые ставят управление рисками на первое место и хотят иметь визуально интегрированный способ управления своими сделками.
Сводка
Профиль индикатора
Отзывы покупателей
5.0
Отзывы: 1
5 | 100 % | |
4 | 0 % | |
3 | 0 % | |
2 | 0 % | |
1 | 0 % |
Отзывы покупателей
April 29, 2025
it helps the review without running the trade, but it should stay as one part of the stack.
Обсуждение
Частые вопросы
Forex
ATR
Продукты, доступные в cTrader Store, включая торговых ботов, индикаторы и плагины, предоставляются сторонними разработчиками и доступны исключительно в информационных и технических целях. cTrader Store не является брокером и не предоставляет инвестиционные консультации, персональные рекомендации или какие-либо гарантии будущей доходности.
Больше от этого автора


Цена
С 13/01/2025
2
Продажи