
説明
ハイロー取引インジケーターの紹介
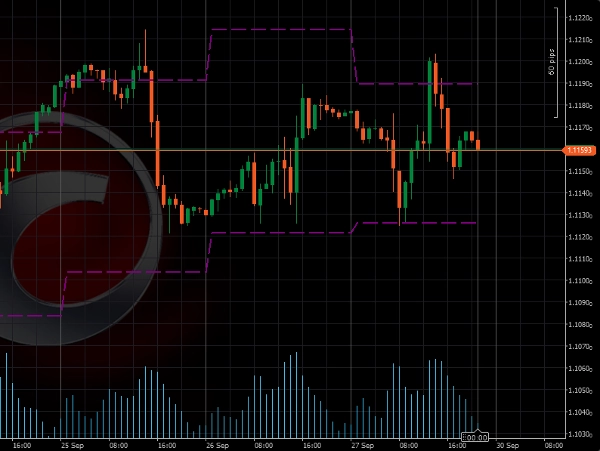
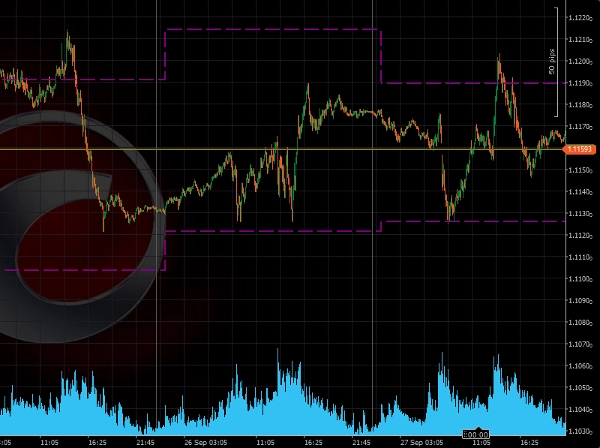
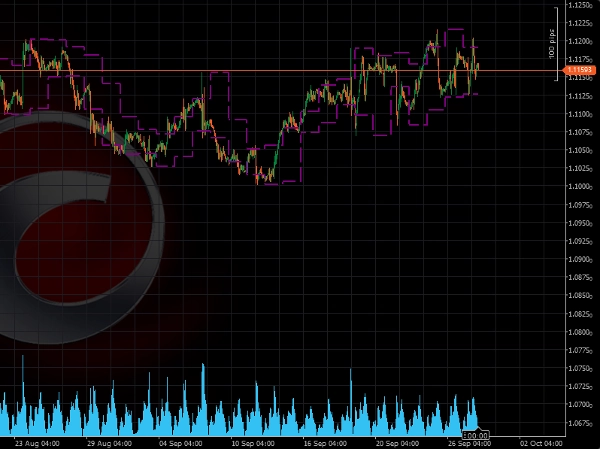
このインジケーターは、前日の最高値と最安値の価格レベルを自動的にチャートにプロットするように設計されています。このツールは、潜在的なブレイクアウトや反転のための重要なレベルを迅速に特定するのに役立ちます。
主な利点:
- ブレイクアウト取引に最適: このインジケーターは前日の重要な価格レベルを強調表示し、これらはしばしばブレイクアウト戦略の基準点として使用されます。これらのレベルの上または下でのブレイクアウト取引は、高い潜在的なセットアップを提供することができます。
- シンプルで効果的: ハイロー取引インジケーターは、価格アクションの最も重要な側面の一つである前日の高値と安値に焦点を当てています。これらのレベルを戦略に取り入れることで、市場構造や潜在的な転換点をより明確に把握できます。
注意点:
- 1日未満のタイムフレームでの使用が最適です
設定:
- 日曜日を含める: デフォルト = いいえ
概要
AIによる概要
The PDHL (Previous Day High & Low) indicator automatically plots the prior day's highest and lowest price levels on trading charts. It is designed to assist traders in identifying key price levels that may signal potential breakouts or reversals. By highlighting these critical levels, the indicator supports breakout trading strategies, providing reference points for entering trades when price moves above or below the previous day's range. The tool emphasizes simplicity and effectiveness by focusing on essential price action elements, helping traders better understand market structure and potential turning points. It is best used on intraday timeframes shorter than one day. A configurable setting allows users to include or exclude Sunday in the calculation, with the default setting excluding it.
インジケーターのプロフィール
カスタマーレビュー
2.5
レビュー: 2
5 | 0 % | |
4 | 0 % | |
3 | 50 % | |
2 | 50 % | |
1 | 0 % |
カスタマーレビュー
October 9, 2025
What Timezone is it in at default? It seems to fail to get the accurate Highs and lOws for different istruments. You could add that as a customisable input. Please add closing price too
July 9, 2025
Pros: Simple and clear display of previous day's high/low levels. Stable performance. Easy to use and customize. Cons: No breakout alerts. No visual zone fill option. Lacks additional filters or Fibo levels.
ディスカッション
よくあるご質問
Breakout
cTrader Storeで入手可能な取引ボット、インジケーター、プラグインなどの商品は、第三者の開発者が提供するものであり、情報と技術の取得のみを目的としてご利用いただけます。cTrader Storeはブローカーではなく、投資助言や個人的な推奨を行うことも、将来のパフォーマンスを保証することもありません。
この作成者の他の商品


価格
登録日 24/09/2024
4.46K
無料インストール