
BWMFI_Visual
Индикатор
77 скачивания
Версия 1.0, May 2025
Windows, Mac
Описание
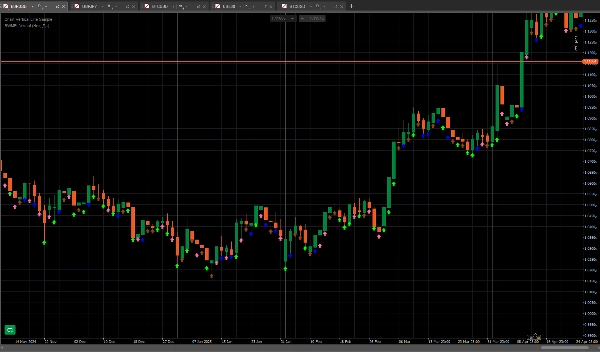
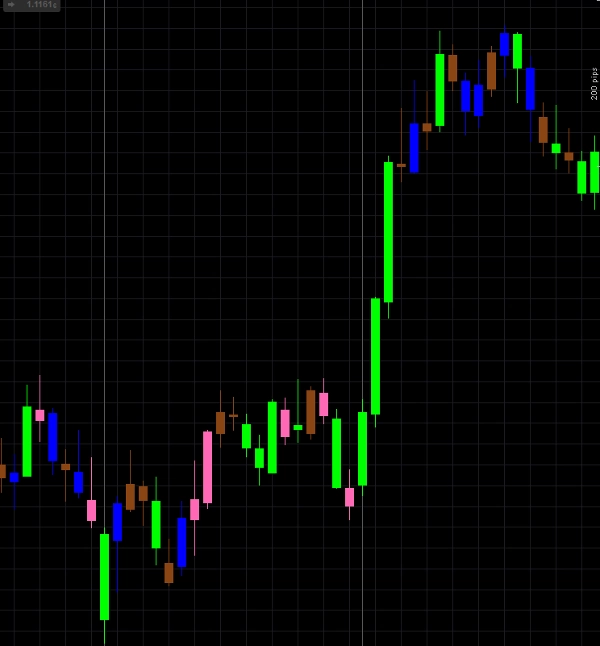
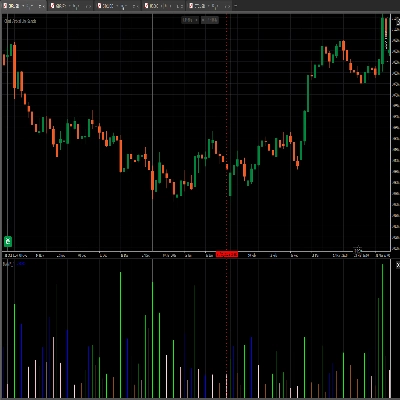
Цветовые полосы BW_MFI Vizual
Сводка
ИИ-сводка
BWMFI_Visual is a trading indicator that visually represents the Money Flow Index (MFI) using color-coded bars. It provides a graphical display of the MFI values to assist traders in analyzing market momentum and potential price reversals. The indicator focuses on enhancing the visual interpretation of the MFI by applying distinct colors to the bars, facilitating quicker and clearer decision-making. This tool is designed for integration within trading platforms that support custom indicators.
Профиль индикатора
Отзывы покупателей
0.0
Отзывы: 0
Отзывы покупателей
У этого продукта еще нет отзывов. Уже попробовали его? Поделитесь впечатлениями!
Обсуждение
Частые вопросы
Продукты, доступные в cTrader Store, включая торговых ботов, индикаторы и плагины, предоставляются сторонними разработчиками и доступны исключительно в информационных и технических целях. cTrader Store не является брокером и не предоставляет инвестиционные консультации, персональные рекомендации или какие-либо гарантии будущей доходности.
Больше от этого автора


![Логотип продукта "High-Low Divergence [Iridio Capital]"](https://cdn.ctrader.com/image/webp/443c4661-7abb-40f1-842f-4b6ec560649b_40914)


Цена
С 10/03/2025
137
Бесплатные установки