
Descripción
https://chartshots.spotware.com/c/695bec6c74055
https://chartshots.spotware.com/c/695bed35bf7b7
https://chartshots.spotware.com/c/695bed6b139df
https://chartshots.spotware.com/c/695bed8ea6bdb
📊 BLOQUE PIVOT BREAKER
🤔
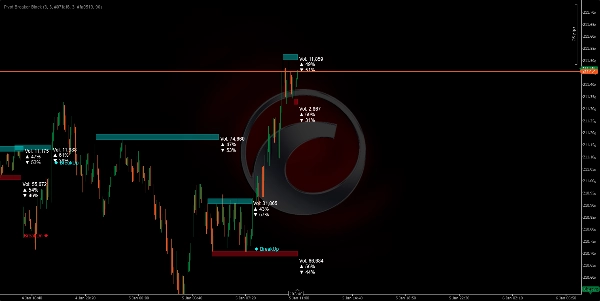
El Bloque Pivot Breaker es un indicador visual que identifica automáticamente puntos clave de giro de precio (máximos y mínimos locales) y construye "bloques de precio" alrededor de estos niveles críticos. Cuando el precio se acerca nuevamente a estos niveles similares, el algoritmo dibuja rectángulos (zonas) que representan resistencia (Oferta) y soporte (Demanda) áreas.
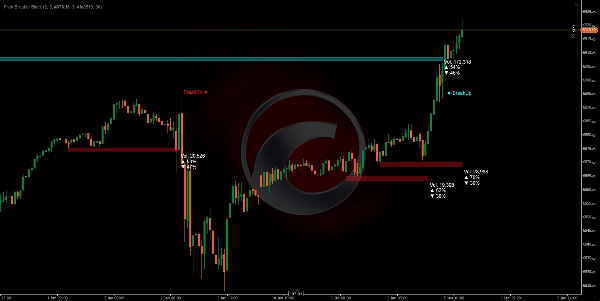
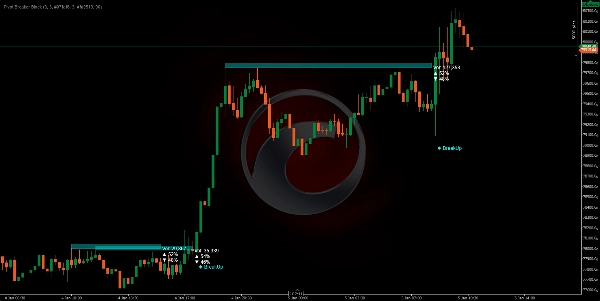
El sistema monitorea continuamente si el precio rompe estas zonas, generando señales visuales claras: BreakUp (ruptura alcista) 🔼 o BreakDn (ruptura bajista) 🔽.
¿PARA QUÉ SIRVE? 🎯
1. Identificar Zonas de Control del Mercado 🗺️
El algoritmo detecta dónde el precio ha mostrado fuerte resistencia (techo de venta) o soporte (suelo de compra). Cuando estos niveles aparecen varias veces, el mercado confirma su importancia.
2. Visualizar la Acumulación y Distribución de Volumen ⚖️
Cada bloque muestra:
- Volumen total procesado en esa zona
- % de compras (velas alcistas) 📈
- % de ventas (velas bajistas) 📉
Esto te permite ver si el mercado está comprando o vendiendo dentro de esa área, revelando la intención del mercado.
3. Anticipar Puntos de Ruptura 🚨
Cuando el precio se acerca a estas zonas, tienes la mayor probabilidad de que ocurra un movimiento significativo. El algoritmo detecta automáticamente cuando el precio las rompe, alertándote en tiempo real.
CÓMO FUNCIONA LA LÓGICA ⚙️
Fase 1: Detección de Pivotes (Puntos de Giro) 🔍
El algoritmo busca máximos y mínimos que cumplan un criterio específico:
- Pivote Alto: Una vela cuyo máximo es más alto que las 5 velas anteriores Y las 5 velas posteriores.
- Pivote Bajo: Una vela cuyo mínimo es más bajo que las 5 velas anteriores Y las 5 velas posteriores.
Este parámetro "5" (Retroceso de Pivote) es ajustable según la volatilidad que desees capturar.
Fase 2: Reconocimiento de Zona de Control 🎯
Una vez identificado un pivote, el sistema lo compara con el pivote anterior del mismo tipo. Si la diferencia entre ellos es menor al 20% del ATR (medida actual de volatilidad), significa que el mercado está revisitando un nivel similar previamente rechazado.
Fase 3: Dimensionamiento de la Zona 📏
La altura de cada bloque se calcula dinámicamente usando el ATR (Rango Verdadero Promedio):
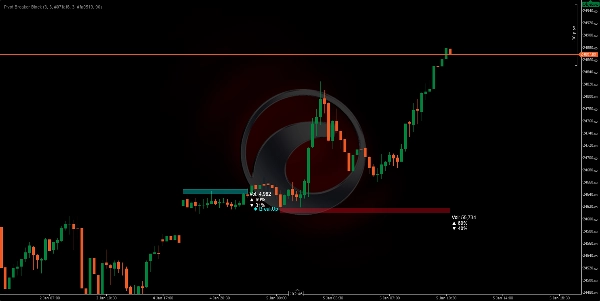
- Oferta (Rojo): El techo está ATR × 0.5 puntos por encima del pivote.
- Demanda (Cian): El suelo está ATR × 0.5 puntos por debajo del pivote.
Esto significa que las zonas se adaptan automáticamente a la volatilidad del activo. En mercados volátiles, las zonas son más amplias; en mercados tranquilos, son más estrechas.
Fase 4: Análisis de Volumen en Tiempo Real 💹
Mientras el precio está dentro de la zona, el algoritmo suma todos los volúmenes de compra y venta desde que comenzó el bloque:
- Compra: Todas las velas donde el cierre es mayor que la apertura (volumen alcista).
- Venta: Todas las velas donde el cierre es menor que la apertura (volumen bajista).
Estos porcentajes te muestran la intención dominante dentro de esa zona.
Fase 5: Detección de Ruptura 🚀
El algoritmo monitorea cada nueva vela:
- BreakUp (↑): El cierre cruza por encima del techo de la Oferta → Señal de ruptura alcista.
- BreakDn (↓): El cierre cae por debajo del suelo de la Demanda → Señal de ruptura bajista.
Cuando esto sucede, el bloque se desactiva y aparece una señal de texto en pantalla.
CÓMO USARLO 🛠️
Instalación y Configuración ⚙️
- Agrega el indicador a tu plataforma cTrader.
- Accede a los parámetros ajustables:
ParámetroSignificadoRecomendación
Retroceso de Pivote
Cuántas velas a la izquierda/derecha se evalúan para confirmar un pivote
5 (estándar), aumentar en TFs mayores
Factor de Zona de Oferta
Altura del bloque rojo (Resistencia)
5.0 (estándar), ajustar a preferencia
Factor de Zona de Demanda
Altura del bloque cian (Soporte)
5.0 (estándar), ajustar a preferencia
Transparencia
Opacidad del bloque (0=invisible, 255=opaco)
90 (recomendado para visibilidad)
Colores
Personaliza la apariencia visual
Rojo para Oferta, Cian para Demanda
Estrategia de Trading 💡
Escenario 1: Entrada Larga (Compra) 📈
- Espera a que el precio forme un bloque de Demanda (cian) con un % de compras > 55%.
- Al ver un BreakUp, confirma tu entrada alcista.
- Stop Loss (SL) por debajo del suelo del bloque.
Escenario 2: Entrada Corta (Venta) 📉
- Busca un bloque de Oferta (rojo) con un % de ventas > 55%.
- En el BreakDn, abre una posición bajista.
- Stop Loss (SL) por encima del techo del bloque.
Escenario 3: Reversión (Reversión a la Media) 🔄
- Si el precio está dentro de un bloque de Demanda pero el % de compras es bajo (< 45%)...
- Anticipa que el precio rebotará hacia arriba sin alcanzar un BreakUp.
- Entra en una compra cerca del suelo con Take Profit (TP) en el techo.
Marcos Temporales Óptimos ⏰
- H4/D1: Bloques más significativos, movimientos de mayor duración.
- H1: Buen equilibrio entre ruido y oportunidades.
- M15: Entrada rápida, requiere confirmación de volumen.
Resumen
The indicator continuously monitors price action relative to these zones, providing real-time breakout signals: "BreakUp" for bullish breakouts above resistance and "BreakDn" for bearish breakouts below support. Each block displays cumulative volume data, including total volume processed and the percentage of buying (bullish) versus selling (bearish) activity, helping traders assess market intention within these areas.
Pivot Breaker Block supports multiple trading strategies, including breakout entries and mean reversion, with configurable parameters such as pivot lookback period, zone height factors, and visual transparency. It is suitable for various markets including Forex, indices, commodities, stocks, and cryptocurrencies, and works effectively on timeframes from 15 minutes to daily charts.
Key features:
- Automatic pivot detection with adjustable lookback
- Dynamic supply and demand zone sizing based on ATR
- Real-time volume accumulation and buy/sell ratio visualization
- Breakout alerts with on-screen signals
- Supports multiple asset classes and timeframes for versatile use


