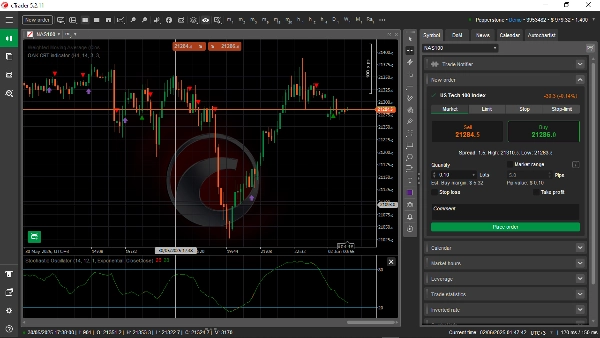
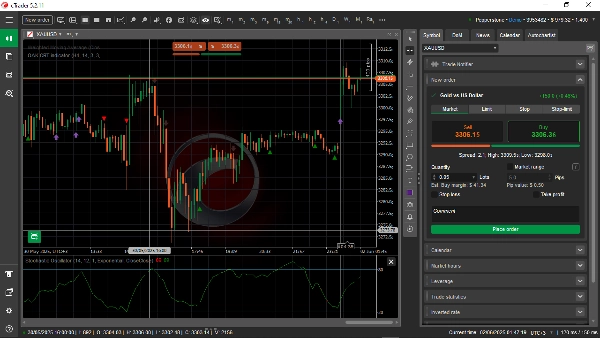
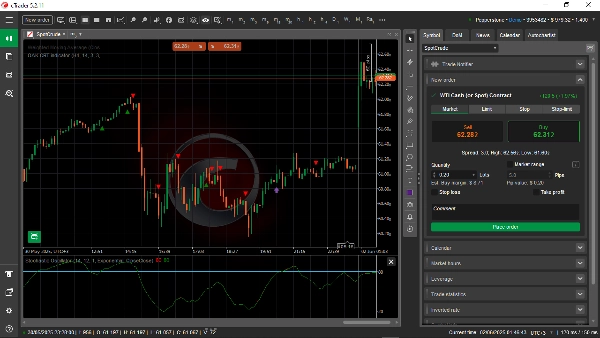
OAK
Indicateur
Version 1.0, Jun 2025
Windows, Mac
Image mise en ligne de "OAK"Image mise en ligne de "OAK"Image mise en ligne de "OAK"
Depuis le 24/02/2025
101.7M
Volume tradé
48.74K
Pips gagnés

The OAK CRT is a sophisticated trading indicator designed to identify potential market reversals and continuations by combining a unique price action pattern with higher timeframe analysis of market momentum. It visually represents trading signals directly on the chart using distinct arrows and triangles, distinguishing between strong and weak buy/sell opportunities. The indicator helps traders align with prevailing trends and anticipate shifts, providing clear visual cues for entry and exit points.

Important Disclaimer: This indicator is a tool to assist in trading and should not be considered the sole basis for any trading decisions. Trading involves significant risk, and past performance is not indicative of future results. This information is not financial advice.

Copyright © 2025 Edderek Tech by Adrian Kwach. All rights reserved.

0.0
Avis : 0
Avis clients
Il n'y a pas encore d'avis sur ce produit. Vous l'avez déjà essayé ? Soyez le premier à en parler aux autres !

Vous pourriez aussi aimer

Indicateur
NAS100
NZDUSD
Martingale
+26
Trend is your friend cBot - Indicator
Trend Is Your Friend cBot - INDICATOR - Professional Grid, Pyramid, Swing & Scalp Trading Indicator
Indicateur
XAUUSD
Forex
EURUSD
+2
Risk & Reward Trading Tool Pro.v2.15
This is a tool to help traders open orders/close orders/modify orders quickly with just one click
Indicateur
Forex
EURUSD
SMC
AsiaSession
Visualize Asia session range with customizable lines for high, low, mid, start, and end.
Indicateur
ZigZag
Signal
Scalping
Double Top and Bottom Pivots
Master market structure with auto ZigZag, Pattern detection & MTF alerts.
Indicateur
Grid
NAS100
RSI
+19
Smart Volume Delta
Detects smart money activity using advanced tick volume and price divergence analysis.
Tiny_Aim_Trainer
trading stress-relief “mini-game”
Indicateur
Breakout
3 Bar Triangle by Linda Raschke
3 bar triangle = high below 2 day high, low above 2 day low
Indicateur
Indices
RSI
XAUUSD
+5
cAlgoBuddy - Composite Index RSI
What Constance Brown did with the RSI was to input a momentum calculation within the RSI itself. This the Composite RSI.
Indicateur
RSI
MACD
SmartBot-MACD & RSI Indicator
This indicator is a combination of MACD and RSI into one. This is perfect fusion and powerful indicator ever.
zh-cn Variety Period clock panel(multilanguage)
This indicator can be used to: change color, shape size, position, change font, increase or decrease, and other function
CandleCounterAlex
CandleCounterAlex – Candle Cycle Counter with Colors and Adjustable Position.
Previous Day Liquidity Zones (PDH - PDL)
Useful indicator for traders who want to visualize key price levels based on previous daily highs and lows.
Depuis le 24/02/2025
101.7M
Volume tradé
48.74K
Pips gagnés