present
Inscrivez-vous et bénéficiez d'une remise de 50 $ sur votre premier achat
Trading product for Heikin Ashi Trend Strength Pro - BrickAlgo Indicateur, image 1
Heikin Ashi Trend Strength Pro - BrickAlgo
Indicateur
Version 1.0, Aug 2025
Windows, Mac
Trading product for Heikin Ashi Trend Strength Pro - BrickAlgo Indicateur, image 2
Trading product for Heikin Ashi Trend Strength Pro - BrickAlgo Indicateur, image 3
Trading product for Heikin Ashi Trend Strength Pro - BrickAlgo Indicateur, image 4
Trading product for Heikin Ashi Trend Strength Pro - BrickAlgo Indicateur, image 5
Trading product for Heikin Ashi Trend Strength Pro - BrickAlgo Indicateur, image 6
Trading product for Heikin Ashi Trend Strength Pro - BrickAlgo Indicateur, image 7
Depuis le 21/02/2025
466.3M
Volume tradé
180.83K
Pips gagnés
26
Ventes
7.49K
Installations gratuites

Description

Heikin Ashi Trend Strength Pro

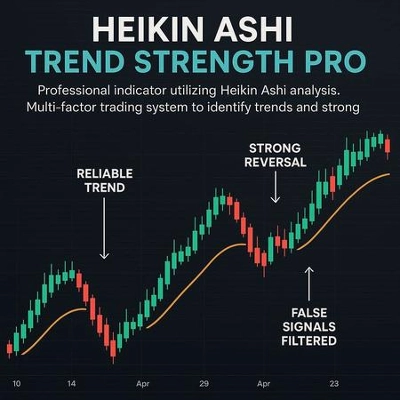
Le Heikin Ashi Trend Strength Pro est un indicateur de qualité professionnelle qui porte l'analyse Heikin Ashi à un niveau supérieur.
Il ne se contente pas de lisser les chandeliers – il offre un système de trading multifactoriel conçu pour vous aider à identifier des tendances fiables, repérer des retournements forts et filtrer les faux signaux.

🔑 Fonctionnalités clés

  • 📊 Force de la tendance Heikin Ashi – visualisez le momentum haussier vs. baissier avec un histogramme clair.
  • ⏱️ Filtre de timeframe supérieur – confirmez les trades avec la tendance dominante sur plusieurs timeframes.
  • 🔊 Analyse de la force du volume – détectez les pics anormaux d'activité de trading pour une confirmation supplémentaire.
  • 🏗️ Détection de la structure du marché – mettez automatiquement en évidence les plus hauts et plus bas des oscillations pour une meilleure cartographie des tendances.
  • 🎯 Génération intelligente de signaux – signaux d'achat et de vente basés sur plusieurs conditions, avec une visualisation distincte pour les configurations fortes et faibles.
  • ♻️ Gestion automatique des signaux – historique configurable, nettoyage automatique et affichage clair sur le graphique.

✅ Pourquoi choisir Heikin Ashi Trend Strength Pro ?

Contrairement aux indicateurs Heikin Ashi standards, cet outil combine force de la tendance, structure du marché, confirmation du volume et analyse des timeframes supérieurs – tout en un seul indicateur.
Il est conçu pour les traders qui veulent clarté, précision et confiance dans leurs décisions de trading.

🚀 Passez votre trading au niveau supérieur

Obtenez des insights plus profonds sur le marché et évitez les faux signaux avec Heikin Ashi Trend Strength Pro.
Que vous soyez scalpeur, trader de swing ou suiveur de tendance à long terme, cet outil vous donne l'avantage nécessaire pour identifier des configurations à haute probabilité.

👉 Ajoutez Heikin Ashi Trend Strength Pro à votre arsenal de trading dès aujourd'hui et tradez avec plus de confiance !

Résumé

Résumé IA
Heikin Ashi Trend Strength Pro is a professional indicator that enhances traditional Heikin Ashi analysis by integrating multiple factors into a comprehensive trading system. It visualizes bullish and bearish momentum through a clear histogram, helping traders assess trend strength. The indicator includes a higher timeframe filter to confirm dominant trends across multiple timeframes, improving trade reliability. It also features volume strength analysis to detect unusual trading activity, providing additional confirmation for market moves.

Market structure detection automatically highlights swing highs and lows, aiding in precise trend mapping. Smart signal generation offers buy and sell signals based on multiple conditions, distinguishing between strong and weak setups for clearer decision-making. Auto signal management ensures configurable history, automatic cleanup, and an uncluttered chart display.

Designed for scalpers, swing traders, and long-term trend followers, this tool combines trend strength, market structure, volume confirmation, and higher timeframe analysis into a single indicator. It aims to provide clarity and accuracy to support high-probability trading setups.
Profil de l'indicateur

Discussion

Avis clients

0.0
Avis : 0
Avis clients
Il n'y a pas encore d'avis sur ce produit. Vous l'avez déjà essayé ? Soyez le premier à en parler aux autres !

Questions fréquentes

Les produits disponibles sur cTrader Store, notamment les bots de trading, les indicateurs et les plug-ins, sont fournis par des développeurs tiers et mis à disposition à titre informatif et à des fins d'accès technique uniquement. cTrader Store n'est pas un courtier et ne fournit aucun conseil en investissement, aucune recommandation personnelle ni aucune garantie quant aux performances futures.

Plus de cet auteur

Indicateur
RSI
Forex
+4
High-probability trading signals in the fast-paced world of forex and CFD trading.
Indicateur
Prop
Stocks
+4
High-Performance Renko Chart Indicator with Advanced filtering method - built for Renko and candlestick charts.
Indicateur
ATR
MSS
+5
Detects ICT Turtle Soup setups — liquidity sweeps with MSS confirmation, ATR filter & kill zone session filter.
Indicateur
SMC
Prop
+15
Automatic Elliott Wave Detection with Professional Filters
Indicateur
Fibonacci
Key Levels
DailyTargets: Dynamic ADR-based levels & targets. Includes Buy/Sell zones, previous Hi/Lo, and automated trend alerts.
Indicateur
EMA
RSI
+2
Advanced TDI indicator with Shark Fin signals, chart arrows, MTF RSI, divergence detection and smart alerts.
Indicateur
Key Levels
Order Block
+3
Marks NY session range, detects wick sweeps beyond box edges.. One signal per day. Overlay, no repainting!
Indicateur
MACD
Key Levels
+2
Trend indicator with multi-timeframe filters, generating signals only on fully completed bricks & candles. No Repaint.
Indicateur
Key Levels
Supertrend
+3
Marks London and New York session opening zones and alerts you instantly on breakouts.
cBot
EMA
SL Manager
+5
Fully automated dual-symbol hedging cBot for cTrader.
20.6%
ROI
8.66
Facteur de profit
Indicateur
BOS
Fair Value Gap
+1
ICT Quarterly Theory indicator — color-coded Q1–Q4 session zones with smart entry signals and real-time alerts.
cBot
RSI
Aggressive
automates entries based on the RSX indicator — a smoothed, low-lag variant of the classic RSI.
1.67
Facteur de profit

Vous pourriez aussi aimer

Indicateur
AI
SMC
+9
Identifies market trends (-10 to +10) using HMA with volume confirmation. Includes customizable alerts.
Indicateur
ATR
BOS
+5
Opening ranges, dynamic trend channels, and multi-scale breakout/retest analysis for clear intraday chart decisions.
Indicateur
VWAP
Volume
+3
Don't trust static support and resistance levels, this indicator combines Fibonacci and VWAP in one powerful tool.
Indicateur
Forex
EURUSD
+5
Fimathe Indicator - Fimathe PCM - Automated Trend Channels & Levels — Ideal for live trading and backteting
Indicateur
ATR
MSS
+5
Advanced market structure and institutional cycle mapper with visual reference cards and entry alerts
Indicateur
Order Block
Breaker Block
+5
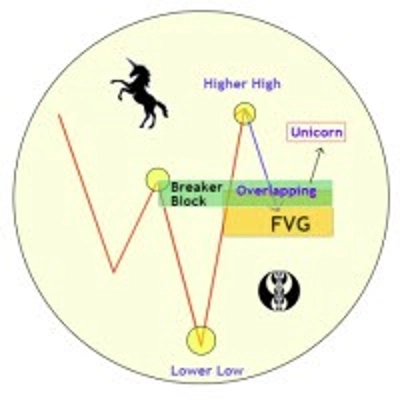
Unicorn Model ICT Indicator — Smart Trading with Precision
Indicateur
Indices
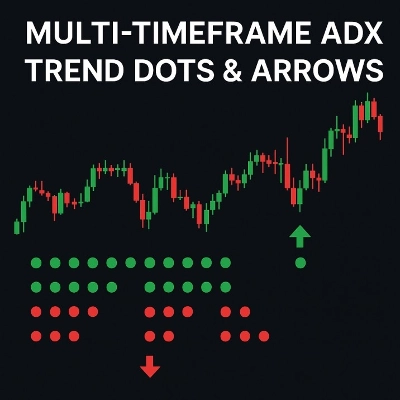
Multi-Timeframe ADX Trend Dots & Arrows
Indicateur
Market Structure
Support & Resistance
Auto-centers price when it moves beyond threshold. Adjustable zoom. Works on any chart type. Never lose price again.
Indicateur
VWAP
NAS100
+5
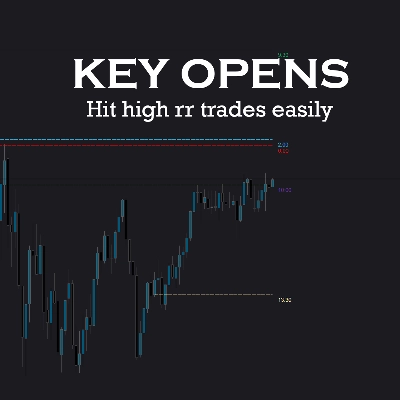
Key NY session opens for NASDAQ (US100) & SP500 to find Tick Precise Entrys for High R:R intraday setups.
Indicateur
Prop
Forex
+11
⚡Nebula Range Filter is a professional trend filter indicator for cTrader⚡
Indicateur
Drawdown Monitor
Proprietary trading desk risk monitoring dashboard!
Indicateur
The Break of Structure (BoSCHoCh) Indicator is a smart market structure tool designed to help traders easily spot trend.
Indicateur
ADX
ATR
+5
Configure, simulate, and analyze trading strategies with custom filters, multi-target exits, and detailed performance me
Indicateur
ATR
Wedge
+2
Strong Supertrend Turn Market Movement into a Clear Map Market analysis
Indicateur
CandleColourFlow MultiFx - optimized to work on Fx Majors, Fx MInors, Fx Crosses
Indicateur
Volume
Imbalance
+5
Spot Institutional Order Flow with Proportional Volume Bubbles & Integrated Cumulative Volume Delta (CVD) Intelligence.
Indicateur
Forex
EURUSD
+4
Check the correlations between dozens of assets in one elegant display.
Indicateur
The Weekly Daily Levels indicator shows the OHLC, and mid-point prices for the previous day and week.

Prix

Depuis le 21/02/2025
466.3M
Volume tradé
180.83K
Pips gagnés
26
Ventes
7.49K
Installations gratuites