Description
⚠️ Nous avons déménagé vers 👉 PrimeQuant
🚫🚫🚫 N'achetez pas cet indicateur !
Cet indicateur OHLC PRO par LudwigICT est un outil de superposition de graphique multifonction conçu pour offrir une visualisation professionnelle et riche en informations sur votre graphique cTrader.
Voici un aperçu de ce qu'il fait :
🔹 Fonction principale : Superposition OHLC
- Dessine des barres OHLC personnalisées (Ouverture, Haut, Bas, Fermeture) sur votre graphique.
- Vous pouvez définir :
-
- Quelle période OHLC utiliser (Journalier, Hebdomadaire, Mensuel, ou intrajournalier comme H1, M15, etc.).
- Décalage des barres (distance par rapport aux chandeliers actuels).
- Largeur des barres, mèches, bordures et couleurs personnalisées.
- Effectivement, vous obtenez des « chandeliers de référence » issus de périodes supérieures placés sur votre graphique actuel.
🔹 Configuration Triple-M (Signaux haussiers/baissiers)
- Détecte un modèle de creux consécutifs plus hauts (haussier) ou de sommets consécutifs plus bas (baissier).
- Lorsqu'il est détecté :
-
- Peut placer des icônes triangulaires (vers le haut ou vers le bas) sur les chandeliers.
- Peut également recolorer les barres pour montrer un changement de momentum.
- Cela agit comme un signal de changement de structure de momentum.
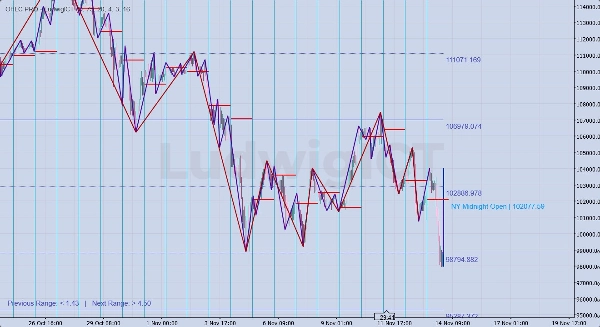
🔹 Outils Dual ZigZag
- Deux superpositions ZigZag indépendantes :
-
- ZigZag #1 (longueur plus longue, par ex. structure de swing).
- ZigZag #2 (longueur plus courte, par ex. micro swings).
- Met en évidence les oscillations du marché pour l'analyse de structure, de tendance et de cassure.
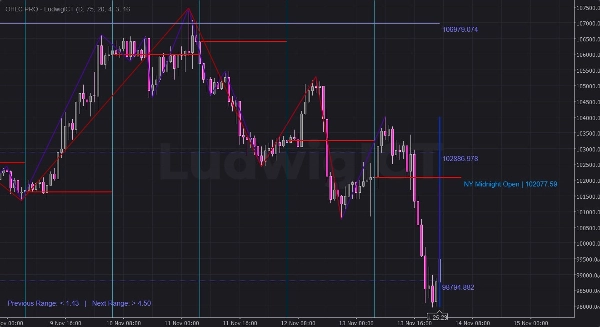
🔹 Supports et Résistances Gann
- Utilise une table de nombres Gann + logique ATR pour calculer les niveaux S/R.
- Trace plusieurs lignes de support/résistance au-dessus et en dessous du prix.
- Les lignes peuvent être stylisées (pleines, pointillées, étendues à gauche, etc.).
- Étiquette les niveaux avec les valeurs de prix.
- Donne également des Guides de plage :
-
- « Plage précédente » vs. « Plage suivante » par rapport à l'ATR.
- Aide à prévoir les zones d'expansion ou de contraction.
🔹 Niveaux de Minuit de New York
- Détecte automatiquement le prix d'ouverture à minuit de la session de New York.
- Trace :
-
- Ligne horizontale au prix d'ouverture à minuit NY.
- Ligne verticale au début de la session.
- Étiquettes affichant « NY Midnight Open | prix ».
- Vous pouvez prolonger ces lignes pour 1 ou 2 jours, ou ajouter des heures supplémentaires.
- Utile pour le trading de style ICT (biais de la session de New York, points d'équilibre, etc.).
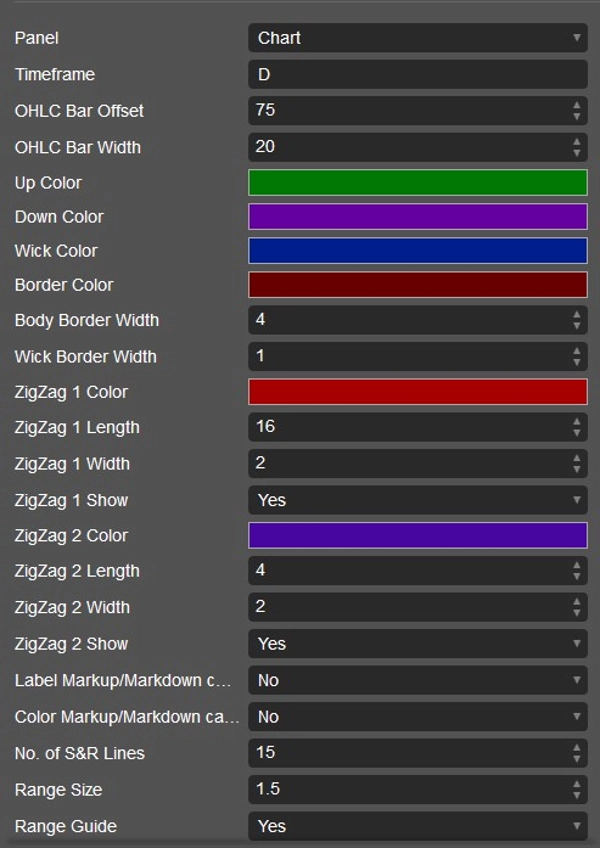
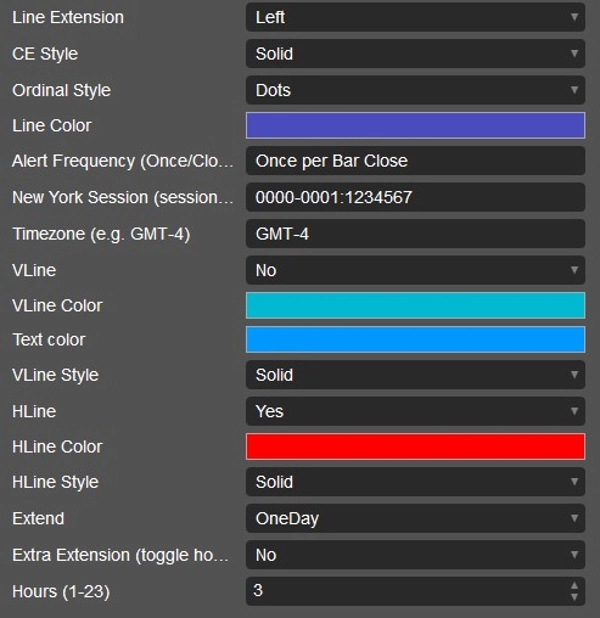
🔹 Personnalisation & Alertes
- Chaque fonctionnalité a des paramètres dans des menus déroulants :
-
- Couleurs, styles, extensions de lignes, nombre de lignes, etc.
- Les alertes sont prises en charge (principalement via les visuels du graphique — le paramètre de fréquence d'alerte est présent).
- Suppression propre à la fermeture de l'indicateur (pour que votre graphique ne reste pas encombré).
✅ En résumé :
Cet indicateur est un outil d'action de prix polyvalent. Il combine :
- Chandeliers OHLC de périodes supérieures
- Signaux de motifs de momentum (Triple-M)
- Deux structures ZigZag
- Niveaux S/R Gann + guides de plage
- Marqueurs d'ouverture à minuit de la session de New York
Il est conçu pour le trading basé sur la structure, la session et les niveaux, particulièrement utile pour les traders de style ICT ou d'action de prix.
J'explique comment vous pourriez l'utiliser pratiquement en tradant XAU/USD
🔹 Utilisation pratique du trading (Or avec OHLC PRO)
1. Superposition OHLC de période supérieure
- Exemple : Tracez OHLC journalier tout en tradant sur M5/M15.
- Vous verrez la bougie d'hier « à l'intérieur » de votre graphique intrajournalier.
- Utilisation :
-
- Prix approchant le plus haut/bas du jour précédent = zone de chasse à la liquidité.
- Ouverture/fermeture journalière = filtre de biais (au-dessus = haussier, en dessous = baissier).
- Vous aide à trader dans la plage journalière.
👉 Sur l'or, la session NY attaque souvent le plus haut/bas du jour précédent avant de rebondir.
2. Signaux Triple-M
- Le motif Triple-M (série de creux en hausse ou de sommets en baisse) = momentum à court terme.
- Utilisation :
-
- Triple-M haussier près du support (creux HTF ou ouverture minuit NY) → possible scalp long.
- Triple-M baissier près de la résistance (haut HTF ou niveau Gann) → possible scalp court.
- Peut colorer les barres pour une reconnaissance visuelle rapide lors de mouvements rapides de l'or.
👉 Fonctionne bien pour les entrées de sniper sur M1–M5 lorsqu'elles sont alignées avec le biais HTF.
3. Dual ZigZag
- ZigZag #1 (longueur plus longue) = structure de swing.
- ZigZag #2 (longueur plus courte) = micro structure.
- Utilisation :
-
- Identifier les ruptures de structure du marché (BOS/CHOCH).
- Trader uniquement dans la direction du plus grand ZigZag (#1).
- Utiliser le plus petit ZigZag (#2) pour la confirmation d'entrée.
👉 Exemple : Biais journalier haussier → attendre un changement haussier du ZigZag #2 près du support HTF.
4. Supports et Résistances Gann
- Génère une grille de niveaux mathématiques S/R.
- Utilisation :
-
- Si le prix se consolide, les niveaux marquent probablement des points de cassure d'expansion.
- Combinez avec le guide de plage ATR :
-
- « Plage précédente » petite → attendez une expansion de la volatilité.
- « Plage suivante » élevée → niveau de cassure fort à venir.
👉 Sur l'or, les niveaux Gann s'alignent souvent avec des nombres ronds (par ex. 2400, 2420, 2435).
5. Ouverture à Minuit de New York
- C'est un des outils ICT les plus puissants pour l'or.
- Utilisation :
-
- Prix relatif à l'ouverture à minuit NY = biais directionnel.
- Si le prix reste au-dessus de l'ouverture à minuit → session NY haussière.
- Si en dessous → biais baissier.
- La ligne horizontale agit comme référence d'équilibre (50%).
- Surveillez les balayages de liquidité autour de ce niveau dans les zones de trading de Londres/NY.
👉 Exemple :
Ouverture à minuit NY = 2405.
- Si Londres fait baisser le prix à 2398 et NY reprend 2405 → configuration longue forte.
🔑 Mise en pratique (Exemple de configuration)
- Début de la session NY :
-
- Tracez OHLC journalier.
- Notez l'ouverture à minuit NY.
- Surveillez les niveaux Gann à proximité.
- Attendez la prise de liquidité (attaque du plus haut/bas journalier ou S/R Gann).
- Vérifiez le Triple-M / ZigZag #2 pour une confirmation micro haussière/baissière.
- Entrez avec un stop derrière le balayage de liquidité.
- Visez le côté opposé de la plage ou le prochain niveau Gann/HTF.
✅ En résumé :
- OHLC journalier + Minuit NY = filtre de biais.
- ZigZag + Triple-M = timing d'entrée.
- Gann + Guide de plage = objectifs de profit & signaux d'expansion.
Cet indicateur vous offre essentiellement tous les outils de style ICT en un seul package pour XAU/USD.
Si vous avez des questions ou rencontrez des problèmes, n'hésitez pas à me contacter. Je suis heureux de vous aider !
Avertissement :
En utilisant mes algorithmes, vous reconnaissez que le trading comporte des risques inhérents et que les performances passées ne garantissent pas les résultats futurs. Il est essentiel d'avoir une stratégie de gestion des risques solide en place et, surtout, de rester discipliné en respectant les niveaux de stop-loss. Un mauvais contrôle des risques peut entraîner des pertes importantes. Je ne suis pas responsable des résultats financiers découlant de l'utilisation de ces algorithmes. Tradez de manière responsable et suivez toujours les bonnes pratiques de gestion des risques.
Bonne chance ! 🙌
Résumé
Avis clients
5 | 100 % | |
4 | 0 % | |
3 | 0 % | |
2 | 0 % | |
1 | 0 % |


