
Description
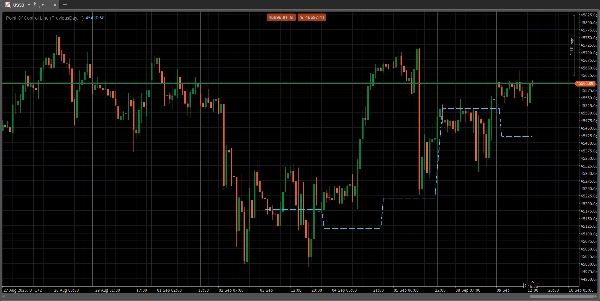
Le Point de Contrôle (POC) est un niveau de prix sur un graphique de profil de volume où le plus grand volume d'échanges a été réalisé sur une période spécifiée. Ce niveau agit comme une zone de support ou de résistance significative car il représente un prix où les grandes institutions de trading étaient les plus actives et où le prix du marché a trouvé un consensus. Les traders utilisent le POC pour identifier les zones de prix clés, évaluer le sentiment du marché et anticiper les mouvements et retournements potentiels des prix.
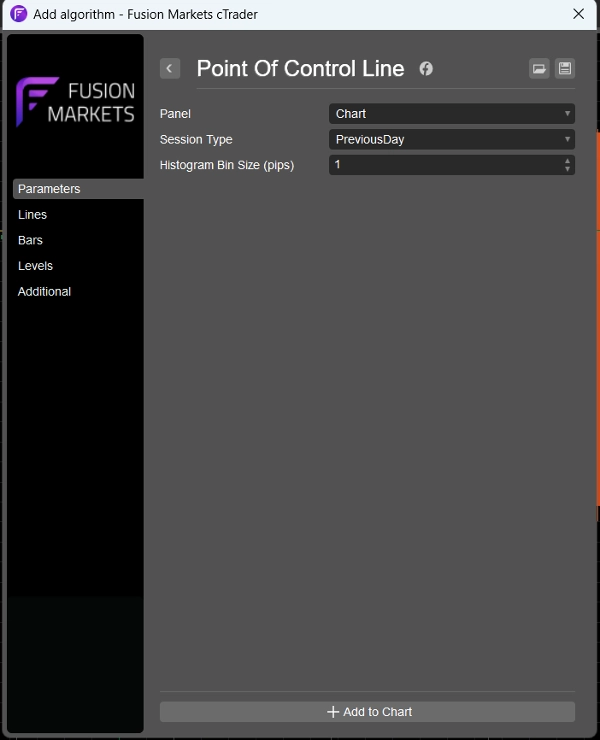
J'ai supprimé tout le bruit des indicateurs habituels de profil de volume en ne laissant que la ligne POC pour ceux qui ne nécessitent que la ligne. J'ai inclus un paramètre pour afficher la ligne POC soit pour la journée précédente, soit pour le profil de volume 4h ou 1h, ce qui la rend adaptée aux traders de différentes périodes.
Résumé
Avis clients
5 | 100 % | |
4 | 0 % | |
3 | 0 % | |
2 | 0 % | |
1 | 0 % |


![Logo de "[Stellar Strategies] Market Session Ultimate"](https://cdn.ctrader.com/image/webp/61ffd537-0125-4246-9e72-42eca1791d64_28232)


