
ATR on Chart
Indicateur
258 téléchargements
Version 1.0, Sep 2025
Windows, Mac
Description
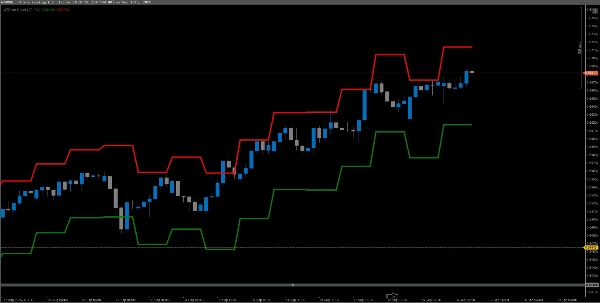
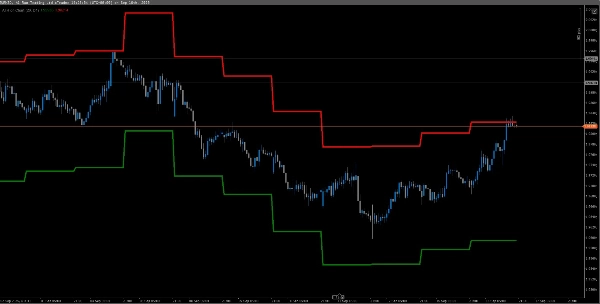
Affiche la plage vraie moyenne. Trace l'ATR sur le graphique pour une visualisation facile, la période par défaut est le journalier mais vous pouvez la modifier.
Résumé
Résumé IA
ATR on Chart is a technical indicator that displays the Average True Range (ATR) directly on the price chart for straightforward visualization. By default, it calculates ATR using the daily timeframe, though users can adjust this setting to other timeframes as needed. This indicator supports various markets including Forex, commodities, indices, and cryptocurrencies, with specific symbols such as BTCUSD, EURUSD, GBPUSD, USDJPY, and XAUUSD among others. It is designed to help traders assess market volatility by plotting ATR values visually, facilitating easier interpretation of price movement ranges.
Profil de l'indicateur
Avis clients
0.0
Avis : 0
Avis clients
Il n'y a pas encore d'avis sur ce produit. Vous l'avez déjà essayé ? Soyez le premier à en parler aux autres !
Discussion
Questions fréquentes
BTCUSD
Forex
Signal
Indices
EURUSD
Commodities
GBPUSD
Crypto
XAUUSD
ATR
USDJPY
Les produits disponibles sur cTrader Store, notamment les bots de trading, les indicateurs et les plug-ins, sont fournis par des développeurs tiers et mis à disposition à titre informatif et à des fins d'accès technique uniquement. cTrader Store n'est pas un courtier et ne fournit aucun conseil en investissement, aucune recommandation personnelle ni aucune garantie quant aux performances futures.


Prix
Depuis le 11/09/2025
258
Installations gratuites