Açıklama
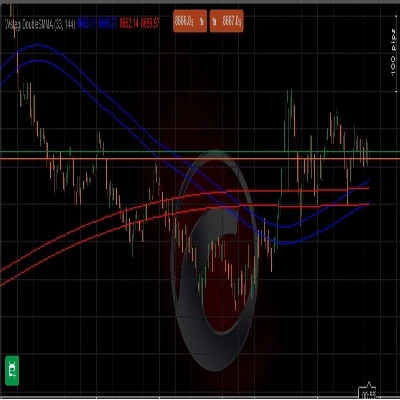
Momentum Reversion Model (MRM) fiyat hareketlerinde potansiyel momentum dönüş bölgelerini görselleştiren teknik bir göstergedir.
Piyasa hareketinin iç yapısını analiz ederek satış baskısının azalmaya başlayabileceği ve toparlanma momentumunun ortaya çıkabileceği alanları vurgular.
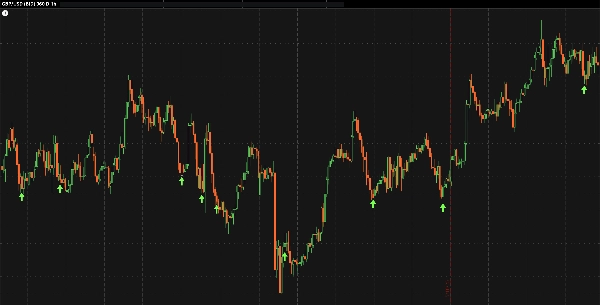
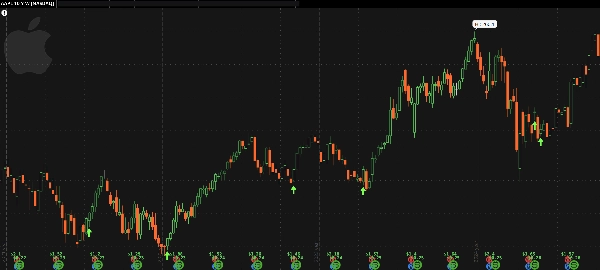
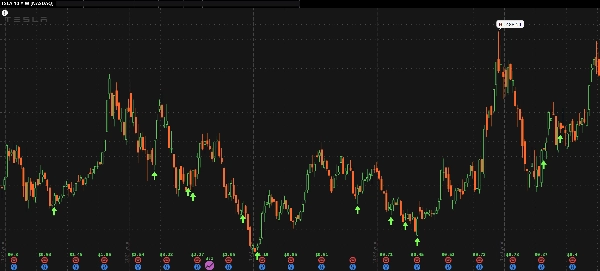
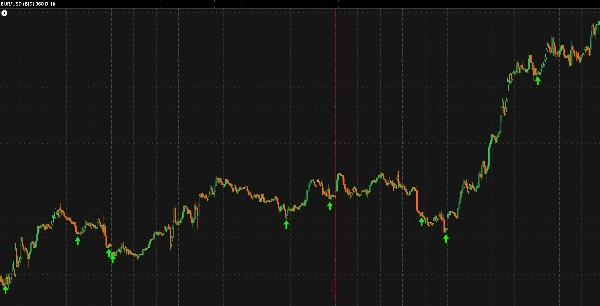
İç modeli koşulları uyduğunda, MRM fiyat çubuğunun altına yeşil bir ok çizer — olası bir dönüş noktasını işaretler.
Birincil olarak 1 saatlik grafiklerde forex piyasaları için tasarlanmış olsa da, benzer analitik davranışı farklı zaman dilimlerinde gözlemlemek için haftalık hisse senedi verilerine de uygulanabilir.
Bu gösterge işlem açmaz veya yönetmez. Mevcut teknik stratejilere veya takdirî düzenlemelere tamamlayıcı olabilecek görsel bir onay katmanı sağlar.
Temel özellikler:
- Momentumda potansiyel tükenme ve toparlanma noktalarını vurgular
- Farklı volatilite ortamlarına içsel olarak uyum sağlar
- Tutarlı analitik davranış için minimum parametreler
💬 Geri bildiriminiz önemli:
Bu aracı faydalı buluyorsanız, lütfen Mağaza'da kısa bir inceleme bırakmayı düşünün.
Gelecekte MRM tabanlı cBot'lar yayımlanmasını isterseniz, geri bildiriminizde bunu belirtmekten çekinmeyin — topluluk ilgisi doğrudan gelecekteki sürümlerin yönlendirilmesine yardımcı olur.
Feragatname:
Momentum Reversion Model yalnızca analitik ve eğitim amaçlı ücretsiz olarak sunulmaktadır.
Finansal tavsiye, işlem rehberliği veya herhangi bir enstrümanı alım ya da satım için öneri teşkil etmez.
Doğruluk, performans veya sonuçlar hakkında herhangi bir garanti verilmez.
Tüm işlem kararları tamamen kullanıcının kendi sorumluluğundadır ve kullanımından kaynaklanan herhangi bir zarar veya kayıp için sorumluluk kabul edilmez.