
WAVETREND_withSourceCode
Indicateur
Version 1.0, Oct 2025
Windows, Mac
5.0
Avis : 2
Description
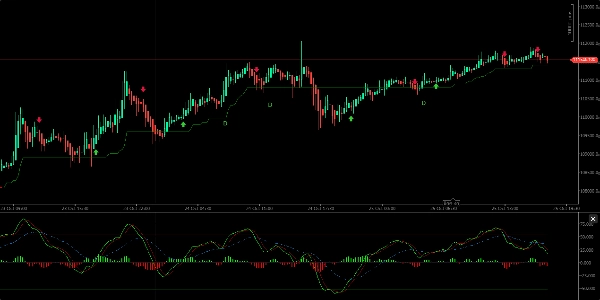
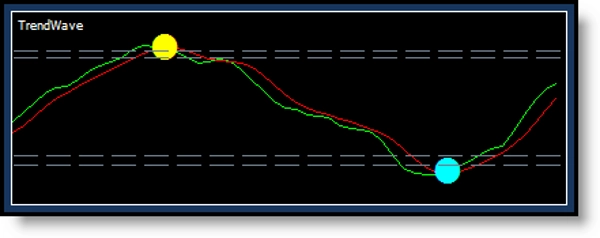
Il fournit des signaux d'achat-vente, une indication de la direction de la tendance, et identifie les zones de surachat et de survente. Visuellement, il comprend deux lignes de valeur avec un nuage/histogramme au centre, qui se déplace au-dessus et en dessous d'une ligne médiane, représentant des tendances à la hausse ou à la baisse.
Caractéristiques principales :
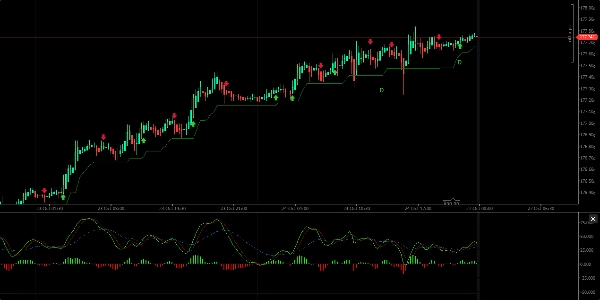
- Les signaux d'achat se produisent lorsque la ligne verte croise la ligne rouge vers le haut ; les signaux de vente lorsque la ligne verte croise vers le bas.
- Il montre la direction de la tendance avec des vagues de nuage au-dessus ou en dessous de la ligne médiane.
- L'indicateur affiche des points verts (achat) et rouges (vente) aux points de croisement, avec des changements de couleur correspondants des chandeliers (jaune pour l'achat, turquoise pour la vente).
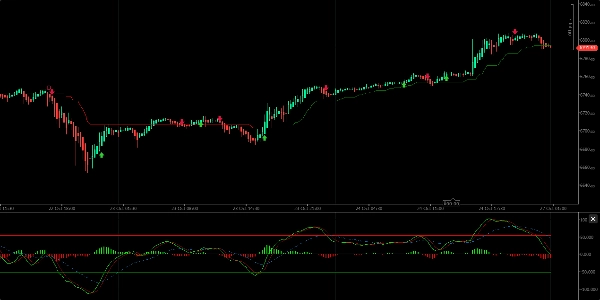
- Il est préférable de l'utiliser sur des intervalles de 12 heures ou 1 jour pour éviter un bruit excessif à court terme.
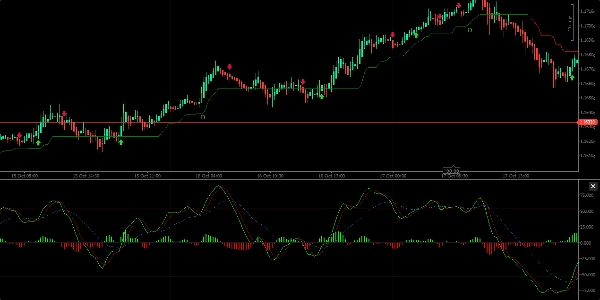
- L'indicateur peut identifier des divergences entre le prix et le momentum (divergence haussière et baissière régulière), signalant des retournements potentiels de prix.
- Il est conseillé de combiner WaveTrend avec d'autres indicateurs comme WMA, CMF, RSI et MACD pour des décisions de trading plus fiables.
Dans l'ensemble, WaveTrend est un outil fonctionnel utile pour identifier la direction de la tendance et les signaux de trading, mais il doit être utilisé avec d'autres outils d'analyse pour confirmation.
Résumé
Profil de l'indicateur
Avis clients
5.0
Avis : 2
5 | 100 % | |
4 | 0 % | |
3 | 0 % | |
2 | 0 % | |
1 | 0 % |
Avis clients
November 6, 2025
the main upside is the trade idea gets slowed down first. The setup still needs say no.
Discussion
Questions fréquentes
Signal
ZigZag
EURUSD
Supertrend
GBPUSD
RSI
XAUUSD
NAS100
ATR
MACD
Les produits disponibles sur cTrader Store, notamment les bots de trading, les indicateurs et les plug-ins, sont fournis par des développeurs tiers et mis à disposition à titre informatif et à des fins d'accès technique uniquement. cTrader Store n'est pas un courtier et ne fournit aucun conseil en investissement, aucune recommandation personnelle ni aucune garantie quant aux performances futures.


Prix
Depuis le 16/03/2025
256
Installations gratuites