
Description
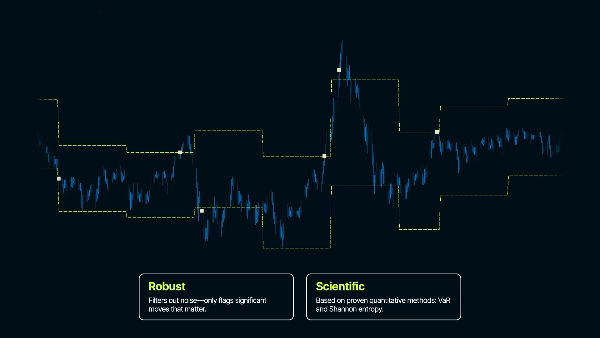
Indicateur Price Jump Exit and Re-entry (PjER) est un indicateur de gestion des risques basé sur l'article académique « A dynamic price jump exit and reentry strategy for intraday trading » par Koegelenberg & van Vuuren (2024), publié dans le journal Expert Systems With Applications.
Innovation clé
- Estimations VaR des pertes potentielles avant qu'elles ne se produisent
- Robustesse face aux fortes tendances du marché sur de courtes périodes
- Analyse de la correction du marché après un saut pour un timing sûr de la réentrée
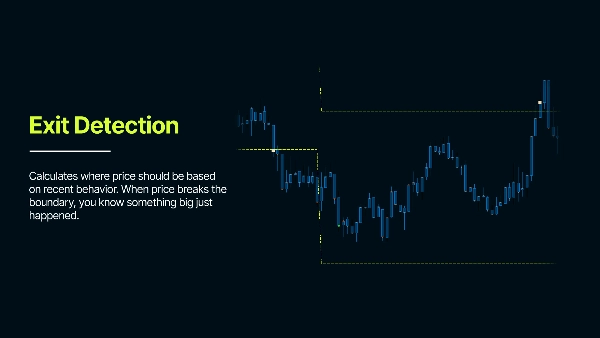
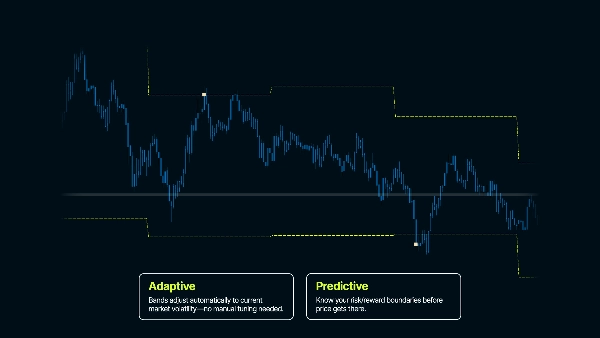
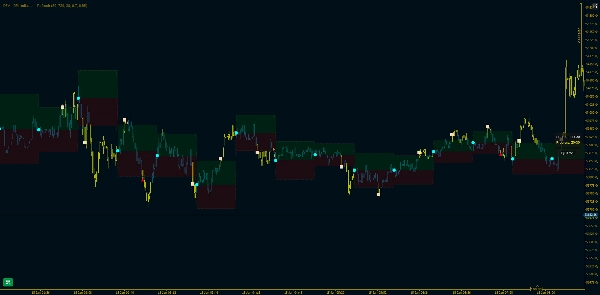
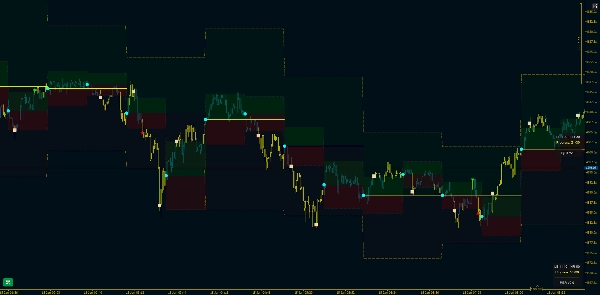
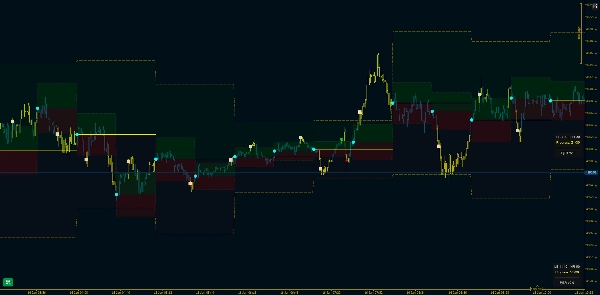
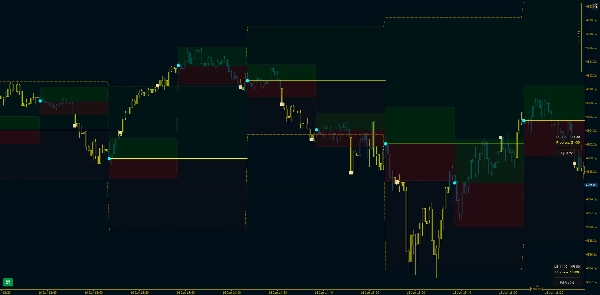
Il analyse les mouvements de prix passés pour comprendre la volatilité typique et crée des intervalles de confiance - représentant la plage de prix attendue. Lorsque le prix sort de ces bandes, cela signale qu'un événement anormal s'est produit.
Cas d'utilisation cible
Trading intrajournalier (en particulier les stratégies basées sur les ranges). Cet indicateur crée des limites statistiques autour du prix pour détecter des mouvements de prix anormaux. Dans un comportement de marché normal, le prix reste dans les plages attendues basées sur la volatilité récente. Lorsque le prix franchit ces bandes, cela signale qu'il se passe quelque chose d'inhabituel - un point de sortie potentiel d'une position ou une cassure dans la structure du marché, car le comportement du marché a changé.
Paramètres principaux expliqués
Max Days Back - Détermine jusqu'où dans l'historique l'indicateur commence à fonctionner
GMT Offset - Ajuste selon votre fuseau horaire. Assure que les calculs de date correspondent à votre heure locale
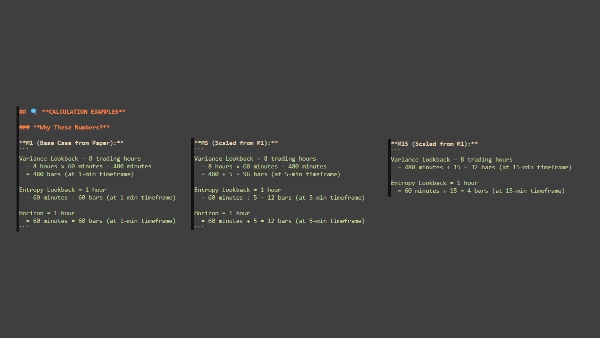
Lookback Period (bars)
« Combien d'historique de prix dois-je utiliser pour mesurer le comportement 'normal' ? »
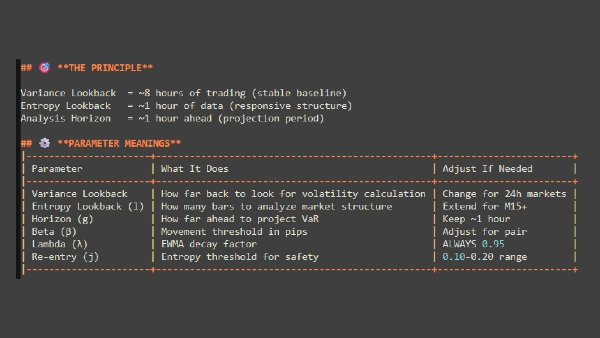
- Combien de barres de données historiques utiliser pour calculer la volatilité
- Plus de barres = plus stable mais adaptation plus lente ; moins de barres = réaction plus rapide mais plus de bruit
- Exemple : 1440 barres en M1 = 24 heures de données
Horizon d'analyse (bars)
« Combien de temps dois-je observer le prix avant de repartir à zéro ? »
- Durée de chaque période d'analyse avant que les bandes ne se réinitialisent
- Définit la période que vous analysez - plus court = réinitialisations plus fréquentes, plus long = bandes fixes plus longtemps
- Exemple : 60 barres = les bandes restent pendant 60 barres, puis recalcul à partir du nouveau prix de référence
Probabilité de risque
« À quel point veux-je être sûr que le prix n'atteindra normalement pas ces niveaux ? »
- Définit le niveau de confiance pour les bandes (comme une marge de sécurité)
- Valeurs plus élevées = bandes plus larges (moins de signaux), valeurs plus basses = bandes plus serrées (plus de signaux)
- Exemple : 0.80 = 80 % de confiance que le prix reste dans les bandes dans des conditions normales
Facteur de décroissance (λ - Lambda)
« Dois-je accorder plus d'importance à ce qui vient de se passer ou traiter tout l'historique de manière égale ? »
- Contrôle le poids accordé aux données récentes par rapport aux données plus anciennes dans le calcul de la volatilité
- Valeurs plus élevées = les données récentes comptent plus ; valeurs plus basses = toutes les données pondérées de manière plus égale
- Exemple 0.95 = la volatilité récente influence fortement le calcul
POINTS CLÉS À RETENIR
Ceci est un outil de GESTION DES RISQUES – Identifie les événements de volatilité et la stabilité sur des périodes de temps
Les intervalles de confiance sont essentiels – Les bandes ne doivent PAS suivre le prix comme l'ATR – Les bandes sont calculées pour chaque période d'analyse
La réentrée nécessite de la patience – Ne vous attendez pas à une réentrée instantanée après la sortie – Le marché a besoin de temps pour se stabiliser
Les paramètres sont spécifiques à l'actif et à la période – Les paramètres par défaut sont des points de départ – Optimisez pour votre marché et style spécifiques – Ce qui fonctionne en FX peut ne pas fonctionner pour les indices, métaux ou crypto.
( * ) Cet indicateur est fourni à des fins éducatives et informatives uniquement. Il ne constitue pas un conseil financier ou d'investissement. Rien dans ce produit, sa documentation ou tout matériel connexe ne doit être interprété comme une recommandation d'acheter, de vendre ou de conserver un instrument financier. Le trading sur les marchés financiers comporte des risques importants et peut ne pas convenir à tous les investisseurs. Les performances passées ne préjugent pas des résultats futurs. Il n'y a aucune garantie de profits, et les utilisateurs peuvent subir des pertes importantes. En utilisant cet indicateur, vous reconnaissez être seul responsable de vos décisions de trading et de vos résultats financiers. Le créateur de ce produit ne pourra être tenu responsable des pertes ou dommages découlant directement ou indirectement de son utilisation. Effectuez toujours votre propre analyse avant de prendre toute décision de trading.
Résumé
Key features include Value at Risk (VaR) estimates to anticipate potential losses, robustness against strong short-term trends, and analysis of post-jump corrections to identify safe re-entry timings. Core adjustable parameters allow users to tailor the indicator to specific assets and timeframes, including lookback period for volatility calculation, analysis horizon for band recalculation frequency, risk probability to set confidence levels, and decay factor to weight recent versus older data.
The indicator emphasizes patience for re-entry after exits, as market stabilization is required. It is intended as a tool for identifying volatility events and managing risk rather than providing direct trade signals. Users should optimize parameters according to their trading style and market conditions.
Avis clients
5 | 100 % | |
4 | 0 % | |
3 | 0 % | |
2 | 0 % | |
1 | 0 % |


