Description
TRB — Indicateur Tick Runs Bars
Détecter les informations du marché avant les mouvements de prix
Tarification d'introduction limitée dans le temps pour les premiers utilisateurs - sécurisez votre exemplaire dès maintenant à un tarif réduit avant que le prix n'augmente pour atteindre le tarif standard une fois la période de lancement initiale terminée.
Version 1.1
Utilisez la section des commentaires pour demander plus de détails
Disponible pour une session vidéo avec guide d'installation après achat
INDICATEUR TICK RUNS BARS (TRB)
Tick Runs Bars étend l'analyse de la microstructure du marché en détectant la persistance directionnelle dans le flux de trading. Également basé sur Advances in Financial Machine Learning de Marcos López de Prado, cet indicateur identifie quand une pression unilatérale du marché s'écarte des niveaux attendus — révélant le fractionnement des ordres institutionnels et l'activité de trading coordonnée.
L'Insight Fondamental
Les traders institutionnels exécutent de gros ordres de manière stratégique — ils les fragmentent en plus petites parties, cachent le volume derrière des ordres iceberg, ou utilisent une exécution algorithmique pour éviter de faire bouger le marché. Ces tactiques laissent des empreintes distinctes sous forme de runs de trading persistants dans une seule direction. Tick Runs Bars détecte ces motifs en mesurant combien de temps un côté domine le flux d'ordres, révélant quand un ordonnancement délibéré et agressif a lieu plutôt que des fluctuations de prix aléatoires.
Comment ça fonctionne
L'indicateur calcule séparément la longueur des volumes d'achats consécutifs et des volumes de ventes consécutives — sans les compenser l'un contre l'autre comme les métriques d'imblance traditionnelles. Il suit l'accumulation maximale de volume unilatéral (θT) par rapport à un seuil attendu dynamique dérivé de la probabilité historique d'achat/vente et des volumes moyens. Lorsque les runs directionnels réels dépassent les attentes, une nouvelle barre TRB est déclenchée. Cela révèle la "forme structurelle" de l'exécution du flux d'ordres — la signature des acteurs institutionnels en action.
Caractéristiques clés
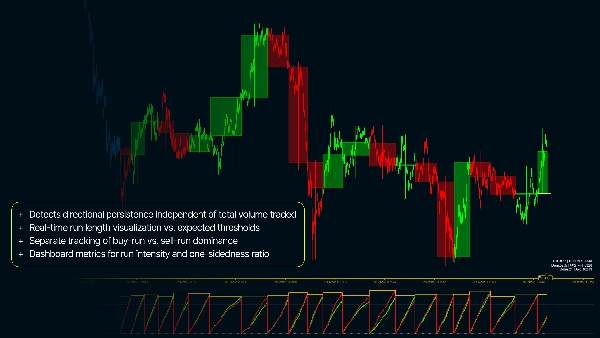
- Détecte la persistance directionnelle indépendamment du volume total échangé
- Visualisation en temps réel de la longueur des runs vs. seuils attendus
- Suivi séparé de la dominance des runs d'achat vs. runs de vente
- Coloration des chandeliers du graphique par appartenance TRB montrant les phases d'exécution des ordres
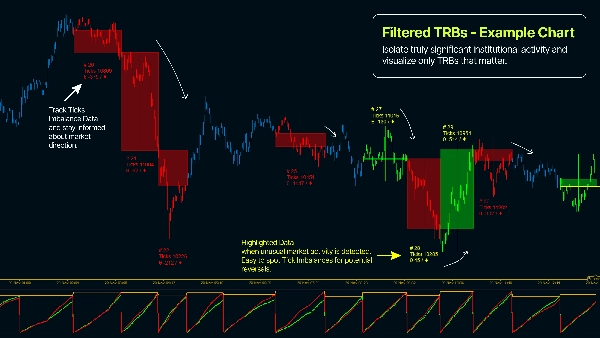
- Filtre de volume minimum pour isoler l'activité institutionnelle réellement significative
- Métriques du tableau de bord pour l'intensité des runs et le ratio d'unilatéralité
- Paramètres configurables de taille de barre attendue et EWMA adaptés à la volatilité de l'instrument
Pourquoi utiliser Tick Runs Bars ?
- Identifier l'exécution des ordres institutionnels en temps réel — avant leur achèvement
- Détecter la liquidité cachée et les modèles d'ordres iceberg via l'analyse du flux
- Distinguer le trading coordonné du bruit aléatoire du marché
- Capturer le mouvement des prix à partir des déséquilibres structurels d'ordres, pas seulement des anomalies statistiques
- Synchroniser les entrées/sorties pendant les périodes de participation institutionnelle connue
- Appliquer une théorie avancée de la microstructure du marché pour gagner un avantage sur des horizons temporels plus rapides
- Réduire les faux signaux dus aux pics de trading mineurs des particuliers


![Logo de "[Hamster-Coder] Pivot Points MTF"](https://cdn.ctrader.com/image/webp/4c143e5a-309c-40e3-a578-f04d1e133ffa_31159)


