
Descrição
Meravith Auto é uma versão automatizada do sistema de negociação manual Meravith.
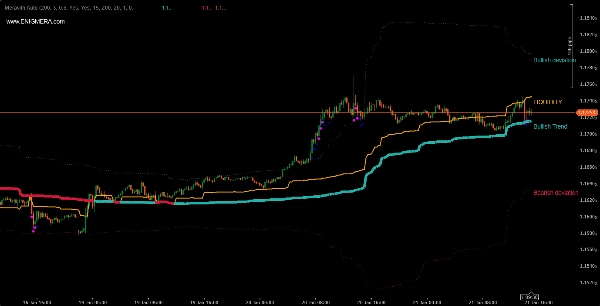
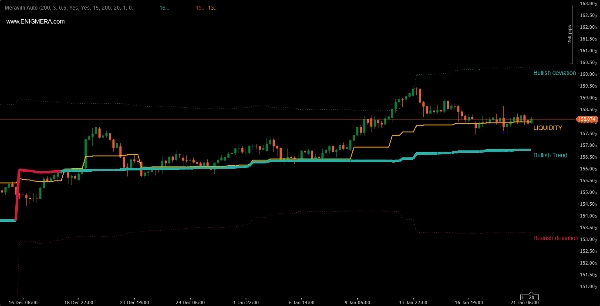
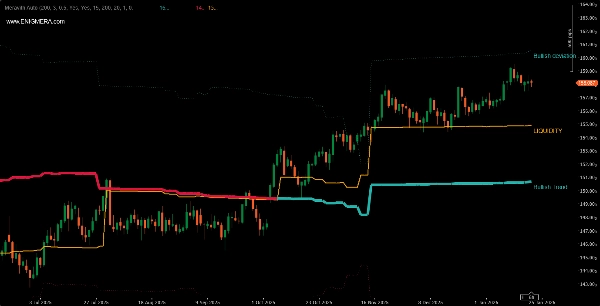
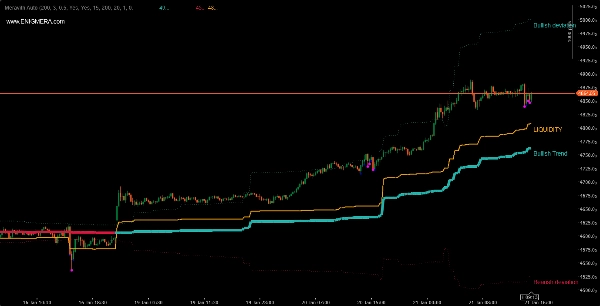
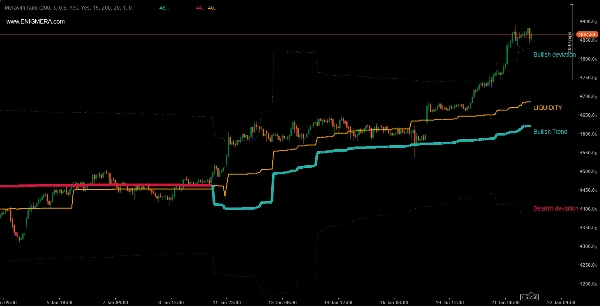
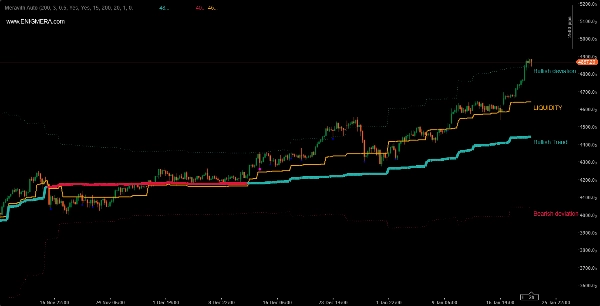
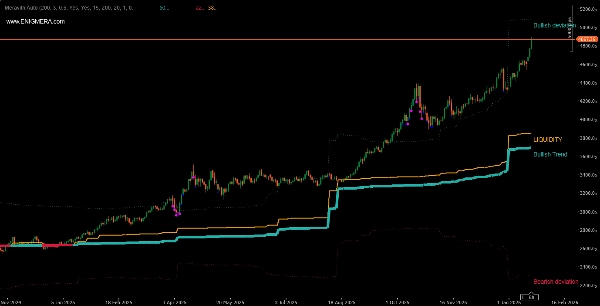
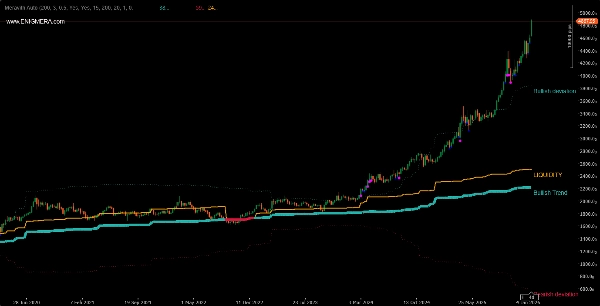
O indicador consiste em:
- Linha de tendência que muda de cor. Quando é de alta, é verde, e quando é de baixa, é vermelha. Esta é a linha de suporte da tendência.
- Linha de liquidez, onde o volume de alta é igual ao volume de baixa.
- Linha de desvio triplo de alta.
- Linha de desvio triplo de baixa.
- Pontos roxos e azuis que indicam alto volume. O ponto roxo indica volume maior por dois desvios da média de volume, e o ponto azul dois desvios.
Como usá-lo?
- Linha de tendência de alta mais liquidez acima da linha de tendência equivale a uma tendência de alta. Esperamos que o mercado se mova para cima. Abrimos posições longas.
- Linha de tendência de baixa mais liquidez abaixo da linha de tendência equivale a uma tendência de baixa. Esperamos que o mercado se mova para baixo. Abrimos posições curtas.
Combine-o a seu critério com outros indicadores.
Pode ser usado em qualquer par e qualquer período de tempo.
Você pode ver resultados diferentes com diferentes corretores devido ao volume que eles cotam.
Corretores maiores são preferíveis devido ao volume mais alto.
Qual é a diferença entre as versões automatizada e manual?
- Na versão manual, temos uma avaliação da tendência baseada em máximas e mínimas. Consequentemente, também fornece níveis de exaustão de volume no mercado.
- Na versão automatizada, temos um período que muda através de diferentes fases do mercado. Pode variar, sendo curto durante alta volatilidade e longo durante baixa volatilidade. Aqui não há níveis de exaustão, pois não se analisa uma tendência, mas sim um período. Esta é a razão pela qual temos desvios. Por padrão, o desvio triplo é exibido.
Resumo
Perfil do indicador
Avaliações de clientes
0.0
Avaliações: 0
Avaliações de clientes
Ainda não há avaliações para este produto. Já o experimentou? Seja o primeiro a contar a outras pessoas!
Conversa
Perguntas frequentes
BTCUSD
Forex
Signal
Breakout
Indices
EURUSD
Commodities
GBPUSD
NZDUSD
Prop
Scalping
Crypto
Stocks
XAUUSD
NAS100
USDJPY
VWAP
Os produtos disponíveis através da cTrader Store, incluindo bots de negociação, indicadores e plugins, são fornecidos por programadores terceiros e são disponibilizados apenas para fins informativos e de acesso técnico. A cTrader Store não é um corretor e não fornece aconselhamento em matéria de investimento, recomendações pessoais ou qualquer garantia de desempenho no futuro.


![Logótipo de "Smart Money Concepts (SMC) [Iridio Capital]"](https://cdn.ctrader.com/image/webp/28b69fd1-ef54-4bed-9487-07e78e883be4_40934)


Preço
Desde 24/10/2025