
Описание
MainChart_EMA_BB_PSAR
Как это работает
1. Основная концепция
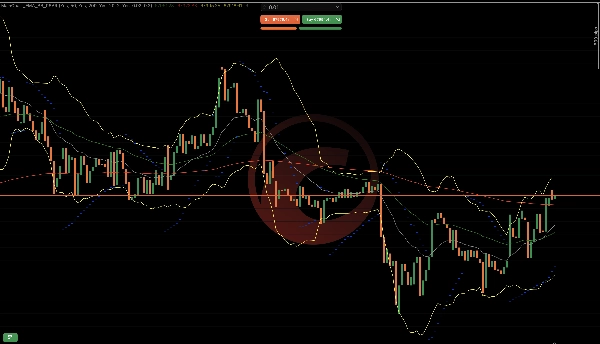
Этот индикатор объединяет логику тренда, волатильности и продолжения импульса в одном наложении:
EMA 50 & EMA 200 → Направление тренда
Полосы Боллинджера → Волатильность и расширение
Параболик SAR → Продолжение тренда и время разворота
Каждый компонент выполняет определённую функцию. Вместе они формируют структурированную систему принятия решений.
2. Логика EMA (Двигатель тренда)
Что делает
Вычисляет экспоненциальные средние закрытия цен.
EMA 50 реагирует быстрее.
EMA 200 реагирует медленнее.
Как интерпретирует рынок
Значение условий
EMA 50 выше EMA 200 — бычий тренд
EMA 50 ниже EMA 200 — медвежий тренд
EMA 50 пересекает EMA 200 — возможный сдвиг тренда
Почему это работает
EMA сглаживает цену и фильтрует шум.
Соотношение 50/200 показывает краткосрочный импульс относительно долгосрочного направления.
3. Логика полос Боллинджера (Двигатель волатильности)
Что делает
Вычисляет скользящую среднюю (средняя полоса)
Строит верхние/нижние полосы с использованием стандартного отклонения
Как интерпретирует рынок
Значение условий
Полосы сужаются — низкая волатильность (сжатие)
Полосы расширяются — высокая волатильность (активное сильное движение)
Цена касается внешней полосы — потенциальное перерасширение
Почему это работает
Рынки циклично переходят между сжатием и расширением.
Выходы часто происходят после сокращения волатильности.
4. Логика Параболик SAR (Двигатель продолжения)
Что делает
Отображает точки выше или ниже цены.
Ускоряется по мере продолжения тренда.
Как интерпретирует рынок
Значение положения точки
Ниже цены — активен восходящий тренд
Выше цены — активен нисходящий тренд
Переключение точки — возможный разворот
Почему это работает
PSAR сужается по мере созревания тренда, помогая отслеживать движения и выявлять истощение.
5. Как все компоненты работают вместе
Бычья структура
EMA 50 выше EMA 200
Цена выше EMA 50
PSAR ниже свечей
Полосы Боллинджера расширяются вверх
→ Указывает на сильный восходящий импульс
Медвежья структура
EMA 50 ниже EMA 200
Цена ниже EMA 50
PSAR выше свечей
Полосы Боллинджера расширяются вниз
→ Указывает на сильный нисходящий импульс
6. Определение фаз рынка
Этот индикатор помогает определить 3 фазы рынка:
Фаза тренда
EMA выровнены
PSAR стабилен
Полосы расширяются
Лучше всего для сделок на продолжение.
Фаза сжатия
Полосы узкие
EMA плоские
PSAR часто переключается
Лучше дождаться пробоя.
Фаза перехода
Формируется пересечение EMA
Переключение PSAR
Полосы расширяются
Возможный ранний разворот.
7. Пример практического потока
Пример последовательности для бычьего тренда:
Сжатие полос
Сильная бычья свеча пробивает верхнюю полосу
EMA 50 пересекает EMA 200 сверху
PSAR переключается ниже цены
Эта последовательность показывает:
Расширение волатильности
Подтверждение тренда
Поддержку продолжения
8. Что он НЕ делает
Не предсказывает новости
Не гарантирует развороты
Не измеряет поток ордеров
Не устраняет ложные пробои
Он предоставляет структурированное подтверждение, а не уверенность.
9. Итоговая модель логики
Фильтр тренда → EMA
Триггер волатильности → Полосы Боллинджера
Время и сопровождение → Параболик SAR
Вместе они уменьшают случайные входы и улучшают структурированное принятие решений.
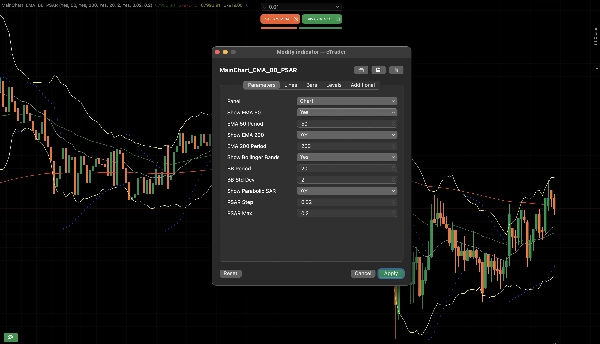
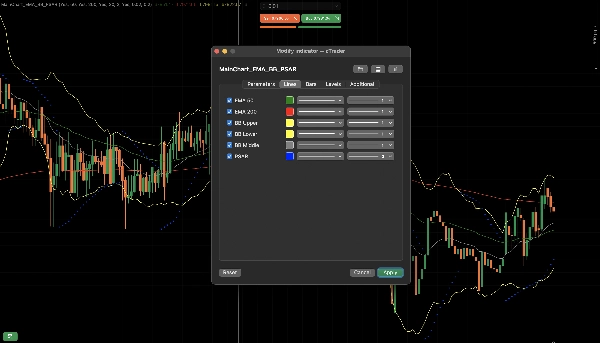
Хорошо в этом индикаторе то, что он настраиваемый и не требует установки нескольких индикаторов.
Сводка
1. Exponential Moving Averages (EMA 50 and EMA 200) to determine trend direction—EMA 50 reacts faster to price changes, while EMA 200 provides a longer-term trend perspective. The relative position of these EMAs signals bullish or bearish trends and potential trend shifts.
2. Bollinger Bands to measure market volatility and detect phases of compression (low volatility) and expansion (high volatility). Narrow bands indicate potential breakout setups, while price touching outer bands suggests possible overextension.
3. Parabolic SAR to identify trend continuation and reversal timing by plotting dots above or below price, signaling active uptrends or downtrends and potential reversals when dots flip position.
Together, these components form a structured decision framework that helps identify market phases—trending, compression, and transition—and supports confirmation of trend strength and momentum. The indicator is configurable and designed to reduce random entries by combining trend filtering, volatility triggers, and timing signals. It is applicable across various markets including Forex, cryptocurrencies, stocks, commodities, and indices. This tool provides structured confirmation for trading decisions but does not predict news events, guarantee reversals, or eliminate false breakouts.
Отзывы покупателей
5 | 50 % | |
4 | 50 % | |
3 | 0 % | |
2 | 0 % | |
1 | 0 % |


