
설명
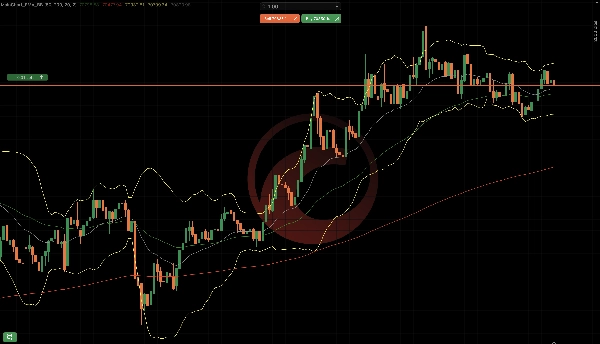
MainChart_EMA_BB 는 cTrader용 메인 차트 오버레이 지표 입니다. 다음을 결합합니다:
- 지수 이동 평균 (EMA 50 & EMA 200)
- 볼린저 밴드 (상단 / 중간 / 하단)
지표 구성 요소
지수 이동 평균 (EMA)
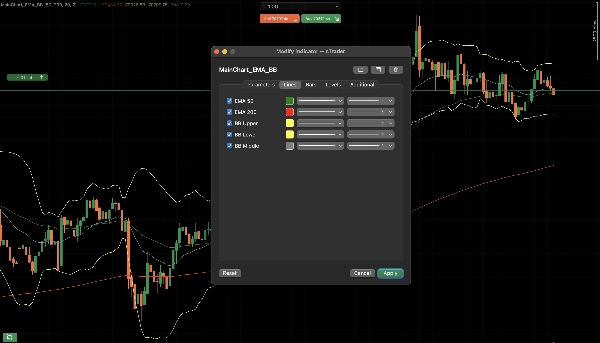
두 가지 EMA가 제공됩니다:
EMA기본 기간기본 색상
EMA 50
50
녹색
EMA 200
200
빨간색
목적:
- 추세 방향
- 동적 지지/저항
- EMA 50이 EMA 200 위에 있을 때 → 강세 편향
- EMA 50이 EMA 200 아래에 있을 때 → 약세 편향
볼린저 밴드
볼린저 밴드는 다음으로 구성됩니다:
- 상단 밴드
- 중간 밴드 (EMA 기반)
- 하단 밴드
기본 설정:
- 기간: 20
- 표준 편차: 2.0
- 이동 평균 유형: 지수
목적:
- 변동성 측정
- 과매수 / 과매도 구역
- 가격이 상단 밴드에 닿으면 → 잠재적 소진
- 가격이 하단 밴드에 닿으면 → 잠재적 반등
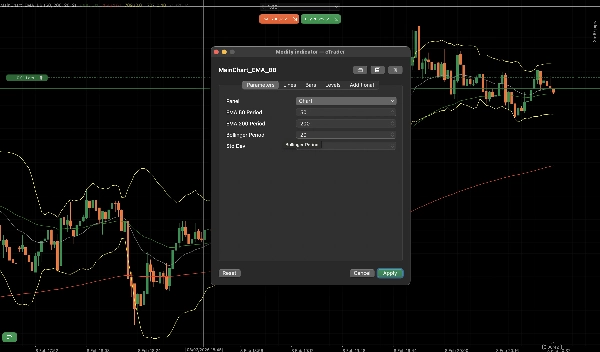
매개변수 설명
EMA 매개변수
- EMA 50 표시: EMA 50 활성화/비활성화
- EMA 50 기간: 계산 기간
- EMA 200 표시: EMA 200 활성화/비활성화
- EMA 200 기간: 계산 기간
볼린저 밴드 매개변수
- 볼린저 밴드 표시: BB 활성화/비활성화
- BB 기간: 조회 기간
- BB 표준 편차: 변동성 배수
일반적인 거래 사용법
추세 확인
- EMA 50이 EMA 200 위에 있음
- 롱 거래만 선호
반전 / 되돌림
- 가격이 EMA 50으로 되돌아옴
- 볼린저 밴드 수축 후 확장
이 지표의 좋은 점은 구성 가능하며 여러 지표를 설정할 필요가 없다는 것입니다.
요약
지표 프로필
고객 리뷰
4.5
리뷰: 2
5 | 50 % | |
4 | 50 % | |
3 | 0 % | |
2 | 0 % | |
1 | 0 % |
고객 리뷰
February 16, 2026
a 1R exit plan makes review easier, and messy areas become easier to avoid.
February 15, 2026
상담
자주 묻는 질문(FAQ)
Prop
Forex
Indices
Commodities
Crypto
Stocks
Bollinger
트레이딩 봇, 지표, 플러그인 등 cTrader Store에서 제공되는 상품은 제3자 개발자에 의해 제공되며, 이는 단순히 정보 및 기술적 접근을 목적으로 제공된 것입니다. cTrader Store는 중개인이 아니며, 투자 조언, 개인별 추천 또는 향후 성과에 대한 어떠한 보장도 제공하지 않습니다.
이 작성자의 상품 더 보기

좋아하실 만한 다른 항목


가격
가입일 01/04/2025