
설명
MainChart_EMA_BB_PSAR
작동 원리
1. 핵심 개념
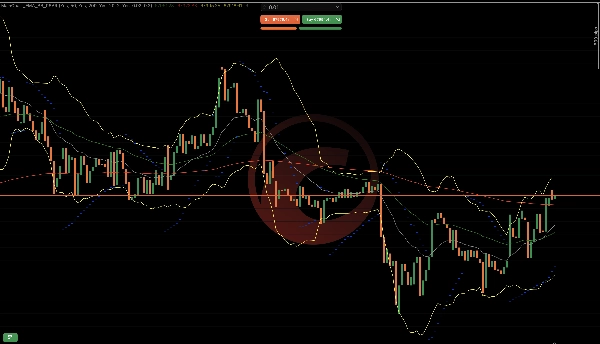
이 지표는 추세, 변동성 및 모멘텀 지속 논리를 하나의 오버레이로 결합합니다:
EMA 50 & EMA 200 → 추세 방향
볼린저 밴드 → 변동성 및 확장
파라볼릭 SAR → 추세 지속 및 반전 타이밍
각 구성 요소는 특정 기능을 수행합니다. 함께 구조화된 의사결정 프레임워크를 형성합니다.
2. EMA 논리 (추세 엔진)
기능
종가의 지수 이동평균을 계산합니다.
EMA 50은 더 빠르게 반응합니다.
EMA 200은 더 느리게 반응합니다.
시장 해석 방법
조건 의미
EMA 50이 EMA 200 위에 있음 강세 추세
EMA 50이 EMA 200 아래에 있음 약세 추세
EMA 50이 EMA 200을 교차함 추세 전환 가능성
작동 이유
EMA는 가격을 부드럽게 하고 노이즈를 필터링합니다.
50/200 관계는 단기 모멘텀과 장기 방향성을 보여줍니다.
3. 볼린저 밴드 논리 (변동성 엔진)
기능
이동평균(중간 밴드)을 계산합니다.
표준편차를 사용해 상단/하단 밴드를 만듭니다.
시장 해석 방법
조건 의미
밴드가 좁아짐 낮은 변동성 (압축)
밴드가 확장됨 높은 변동성 (강한 움직임 활성)
가격이 외부 밴드에 닿음 과도한 확장 가능성
작동 이유
시장은 압축과 확장 사이를 순환합니다.
변동성 수축 후 돌파가 자주 발생합니다.
4. 파라볼릭 SAR 논리 (지속 엔진)
기능
가격 위 또는 아래에 점을 표시합니다.
추세가 지속됨에 따라 가속화됩니다.
시장 해석 방법
점 위치 의미
가격 아래 상승 추세 활성
가격 위 하락 추세 활성
점이 뒤집힘 반전 가능성
작동 이유
PSAR는 추세가 성숙해짐에 따라 조여져 움직임을 추적하고 소진을 감지하는 데 도움을 줍니다.
5. 모든 구성 요소의 협력 작용
강세 구조
EMA 50이 EMA 200 위에 있음
가격이 EMA 50 위에 있음
PSAR가 캔들 아래에 있음
볼린저 밴드가 위로 확장 중
→ 강한 상승 모멘텀을 나타냄
약세 구조
EMA 50이 EMA 200 아래에 있음
가격이 EMA 50 아래에 있음
PSAR가 캔들 위에 있음
볼린저 밴드가 아래로 확장 중
→ 강한 하락 모멘텀을 나타냄
6. 시장 단계 감지
이 지표는 3가지 시장 단계를 식별하는 데 도움을 줍니다:
추세 단계
EMA 정렬
PSAR 일관성
밴드 확장 중
지속 거래에 가장 적합합니다.
압축 단계
밴드가 조여짐
EMA 평탄
PSAR 자주 뒤집힘
돌파를 기다리는 것이 가장 좋습니다.
전환 단계
EMA 교차 형성 중
PSAR 뒤집힘
밴드 확장 중
잠재적 초기 반전.
7. 실용적 흐름 예시
예시 강세 시퀀스:
밴드 압축
강한 강세 캔들이 상단 밴드를 돌파함
EMA 50이 EMA 200 위로 교차
PSAR가 가격 아래로 뒤집힘
이 시퀀스는 다음을 보여줍니다:
변동성 확장
추세 확인
지속 지원
8. 하지 않는 것
뉴스를 예측하지 않습니다
반전을 보장하지 않습니다
주문 흐름을 측정하지 않습니다
거짓 돌파를 제거하지 않습니다
확실성이 아닌 구조화된 확인을 제공합니다.
9. 요약 논리 모델
추세 필터 → EMA
변동성 트리거 → 볼린저 밴드
타이밍 및 추적 → 파라볼릭 SAR
함께, 무작위 진입을 줄이고 구조화된 의사결정을 개선합니다.
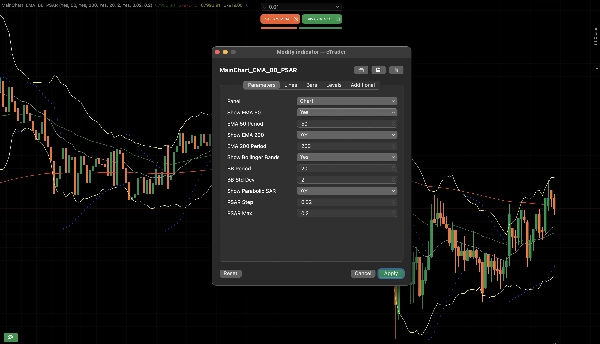
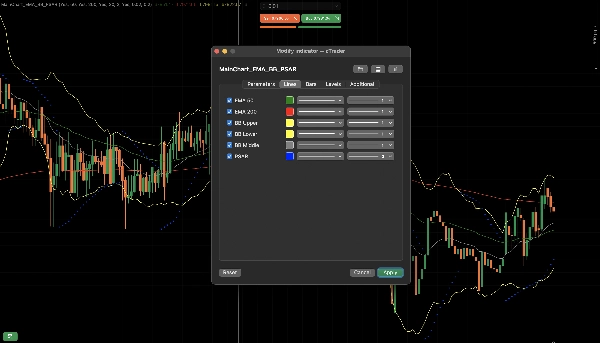
이 지표의 좋은 점은 구성 가능하며 여러 지표를 설정할 필요가 없다는 것입니다.
요약
1. Exponential Moving Averages (EMA 50 and EMA 200) to determine trend direction—EMA 50 reacts faster to price changes, while EMA 200 provides a longer-term trend perspective. The relative position of these EMAs signals bullish or bearish trends and potential trend shifts.
2. Bollinger Bands to measure market volatility and detect phases of compression (low volatility) and expansion (high volatility). Narrow bands indicate potential breakout setups, while price touching outer bands suggests possible overextension.
3. Parabolic SAR to identify trend continuation and reversal timing by plotting dots above or below price, signaling active uptrends or downtrends and potential reversals when dots flip position.
Together, these components form a structured decision framework that helps identify market phases—trending, compression, and transition—and supports confirmation of trend strength and momentum. The indicator is configurable and designed to reduce random entries by combining trend filtering, volatility triggers, and timing signals. It is applicable across various markets including Forex, cryptocurrencies, stocks, commodities, and indices. This tool provides structured confirmation for trading decisions but does not predict news events, guarantee reversals, or eliminate false breakouts.
고객 리뷰
5 | 50 % | |
4 | 50 % | |
3 | 0 % | |
2 | 0 % | |
1 | 0 % |


