الوصف
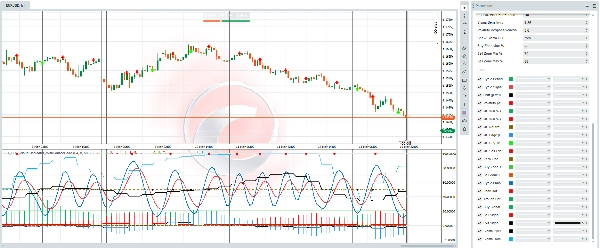
يعتمد معظم المتداولين على مؤشرات متأخرة تستجيب للسعر بعد حدوث الحركة. الـ محرك FFT-SDE المرئي يتبع نهجًا كميًا مختلفًا جذريًا. إنه ليس مجرد مذبذب؛ بل هو مجموعة معالجة إشارات وتوقعات في الوقت الحقيقي مدمجة مباشرة في cTrader.
يعمل على مبدأين أساسيين:
- للسوق إيقاعات (دورات): باستخدام تحليل تحويل فورييه السريع (FFT)، يقوم المؤشر بتفكيك حركة السعر إلى مكوناته الترددية الأساسية، مع تصفية الضوضاء لكشف الدورة السائدة والقابلة للتداول. هذا يخبرك متى من المرجح أن ينقلب السوق.
- لحركة السعر طبيعة إحصائية (SDE): من خلال نمذجة السعر كمعادلة تفاضلية عشوائية (عملية أورنشتاين-أولينباك)، يقيس انحراف السوق (الزخم)، والتقلب (المخاطرة)، وسرعة العودة إلى المتوسط. هذا يخبرك كيف من المرجح أن يتحرك السوق و احتمالية نجاح الصفقة.
من خلال دمج هذين العالمين—تحليل الدورة (FFT) و التنبؤ العشوائي (SDE)—يوفر محرك FFT-SDE رؤية شاملة للسوق غير متوفرة في الأدوات القياسية.
2. الفائدة الأساسية: ما المشكلات التي يحلها؟
إليك كيف يمكن للمتداول استخدام هذا المؤشر لتحسين اتخاذ قراراته:
- المشكلة 1: "لا أستطيع تحديد ما إذا كان السوق يتجه أو يتراوح فقط."
-
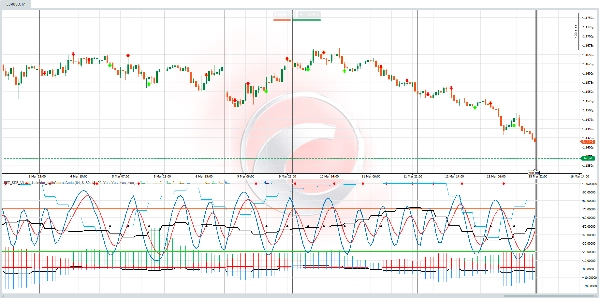
- الحل (فترة الدورة ودورية سيغما): يعرض مخطط فترة الدورة طول دورة السوق السائدة الحالية فورًا. عندما تكون الدورة واضحة وقوية، يمكنك التداول على التقلبات. عندما تكون نسبة دورية سيغما % (دورة التقلب) مرتفعة، تعرف أن تتوقع فترات توسع وانكماش في المخاطر، مما يسمح لك بضبط حجم مركزك ديناميكيًا.
- المشكلة 2: "دخولاتي دائمًا مبكرة جدًا أو متأخرة جدًا."
-
- الحل (مرحلة الدورة ومناطق الدخول): يرسم المؤشر دورة السوق على موجة ناعمة من 0-100%—وهي نسبة مرحلة الدورة % . بدلاً من التخمين حول القمم والقيعان، يمكنك الانتظار حتى يدخل السعر إلى مناطق الشراء (0-35%) و البيع (60-88%). هذه ليست مستويات عشوائية؛ بل مستمدة ديناميكيًا من التردد السائد للسوق، مما يمنحك ميزة توقيت كبيرة.
- المشكلة 3: "لا أعرف ما إذا كان الإعداد لديه احتمال نجاح مرتفع."
-
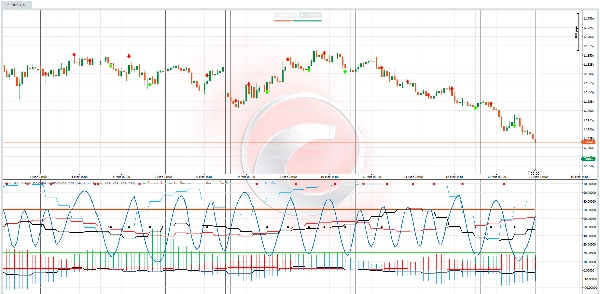
- الحل (محاكاة مونت كارلو): هذه هي الميزة الحاسمة. لكل شريط، يقوم المحرك بتشغيل مئات مسارات السعر المحاكاة (مونت كارلو) بناءً على ديناميكيات السوق الحالية. ثم يعرض نسبة الفوز MC (شراء) و نسبة الفوز MC (بيع) . هذا ليس شعورًا أو تخمينًا؛ بل هو احتمال إحصائي لنجاح صفقة بنسبة مخاطرة إلى مكافأة 1:2.5 قبل حتى دخولك فيها. يمكنك حرفيًا رؤية ما إذا كانت الاحتمالات في صالحك.
- المشكلة 4: "المؤشرات القياسية بطيئة جدًا ومليئة بالضوضاء."
-
- الحل (تكيفي ومتعدد الجوانب): هذا المؤشر ليس ثابتًا. نموذج التقلب التكيفي يستجيب في الوقت الحقيقي لصدمات السعر ونبضات الدورة. الـ سيغما FFT يخبرك إذا كان التقلب نفسه يصبح دوريًا، محذرًا من فترات هدوء أو انفجار وشيكة. كل مكون مصمم ليتكيف مع ظروف السوق الحالية.
لن تجد مؤشرًا آخر في سوق cTrader يجمع هذه الميزات في نظام واحد متماسك ومرئي.
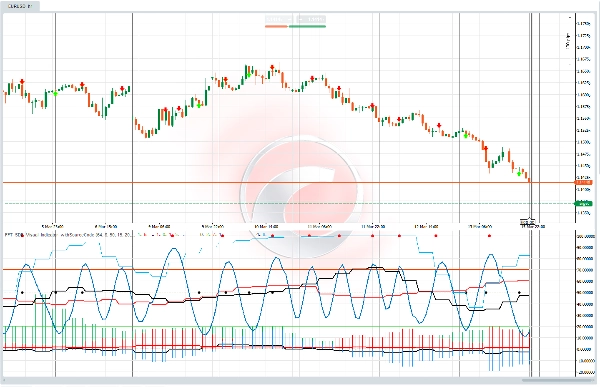
- طبقة "سيغما FFT": معرفة أن للسعر دورة شيء واحد. لكن معرفة أن التقلب نفسه له دورة هو مستوى جديد تمامًا من التعقيد. هذا يوفر ميزة هائلة في توقع تغييرات هيكل السوق.
- ميزة احتمالية، وليست يقينية: توجه مخرجات مونت كارلو المتداول بعيدًا عن البحث عن "الكأس المقدسة" من اليقين ونحو عقلية احترافية لإدارة الاحتمالات والميزات.
- مرئي بالكامل وقابل للتخصيص: كل هذه الرياضيات المعقدة معروضة في تنسيق متعدد اللوحات نظيف مع تخصيص واسع (أكثر من 27 معلمة). يمكنك تكييفه مع أسلوب تداولك المحدد، من السكالبينج إلى التداول المتأرجح.
- دمج متماسك: مرحلة الدورة التي تولد إشارات الشراء/البيع الخاصة بك هي نفس الدورة المستخدمة لحساب الانحراف والتقلب التكيفي. كل جزء من المؤشر يتكامل مع الآخر، مما يخلق نموذج سوق موحد ومتسق.
هذا المؤشر مثالي للمتداول الذي:
- سئم من المؤشرات المتأخرة ويريد نهجًا أكثر تنبؤًا وعلميًا.
- لديه بعض الفهم للدورات، والتقلب، وقيمة الاحتمالية الإحصائية.
- يريد بناء نظام تداول قوي قائم على القواعد.
- يتداول أدوات ذات سلوك دوري (مثل أزواج الفوركس، المؤشرات، السلع مثل الذهب).
- مستعد للاستثمار في أداة احترافية للحصول على ميزة حقيقية في الأسواق.
محرك FFT-SDE المرئي يحول مفاهيم التمويل الكمي المعقدة إلى أداة تداول عملية وقابلة للتنفيذ. ينقلك من التخمين إلى المعرفة، ومن رد الفعل إلى التوقع. إذا كنت مستعدًا للتداول بفهم أعمق لهياكل السوق وميزة احتمالية قابلة للقياس، فهذا هو المحرك الذي كنت تنتظره.
الملخص
تقييمات العملاء
5 | 67 % | |
4 | 33 % | |
3 | 0 % | |
2 | 0 % | |
1 | 0 % |