
说明
Imperium MTF 热力图 是一个独特的顶级 cTrader 指标,专为那些不仅仅满足于信号的交易者设计——他们追求市场控制、视觉清晰度和真正的交易价值。
该指标通过结合多时间框架对齐、移动平均逻辑、方向强度和确认行为,打造出一个强大的热力图系统,揭示短期市场运动的真实结构。
它最大的优势不仅在于显示什么,更在于显示的速度和清晰度。在快速变化的市场中,决策必须瞬间完成。 Imperium MTF 热力图帮助您识别多头和空头压力,确认动量质量,并在关键层面发现对齐,而不会让您的图表被不必要的噪音所干扰。
默认设置专门针对 Tick30 和 Minute1 进行了优化,使该指标对在快速、精确环境中操作的活跃交易者极具价值。从您应用它的那一刻起,它就准备好工作了。
这是一个具有真正持久力的高级指标。
它是一种工具,一旦您看到它的实际效果,就会迅速成为您交易日常的一部分,因为它提供的信息难以忽视。
许多指标使用一段时间后就被移除。
Imperium MTF 热力图则不同。
它提供了如此实用且即时的视觉优势,自然而然地成为您每天反复使用的指标之一。一旦它出现在您的图表上,您开始通过它解读市场,没有它交易就像失去了一层重要的意识。
如果您想要一个独特、强大且真正有用的 Tick30 和 Minute1 交易指标,Imperium MTF 热力图 正是如此。
如何使用 Imperium MTF 热力图
Imperium MTF 热力图 旨在帮助您以快速且直观的方式读取市场方向、强度和对齐情况。
它无需依赖多个独立指标,即可即时概览多个层面的趋势压力。
指标核心显示市场是倾向多头还是空头,该压力有多强,以及不同行是否对齐。这使得识别高质量交易条件和避免弱或噪声设置变得更容易。
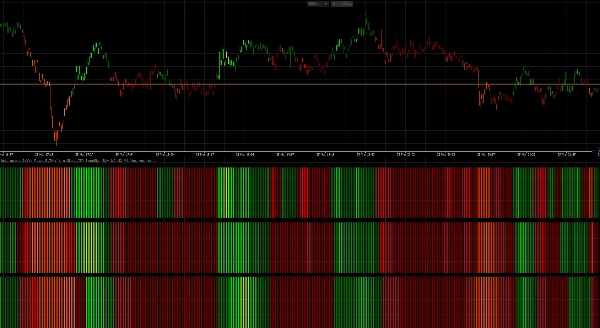
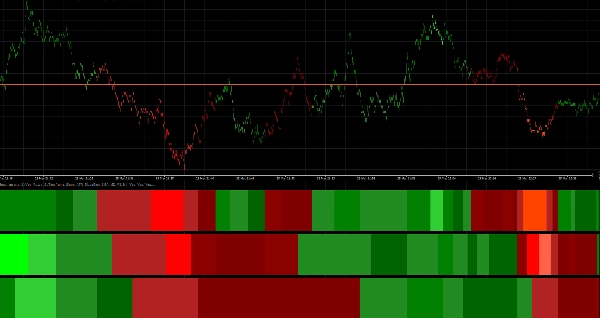
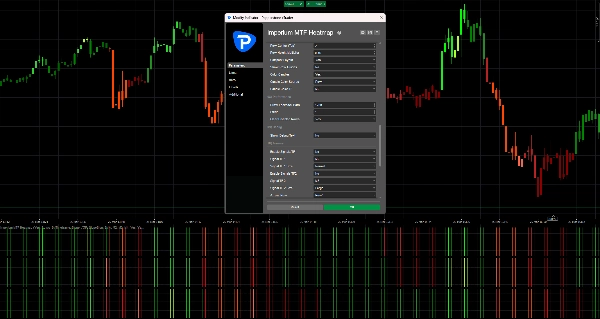
热力图显示内容
热力图由 3 行 构成,每行代表一个独立的时间框架或移动平均层,具体取决于您的布局。
- 绿色区域 表示多头压力
- 红色区域 表示空头压力
- 更亮/更强的颜色强度 表示更强的动量或趋势强度
- 弱或不稳定的条件 显得不那么强烈,应更加谨慎对待
当多行朝同一方向对齐时,市场通常结构更好,动量更清晰。
这正是该指标特别有价值的地方。
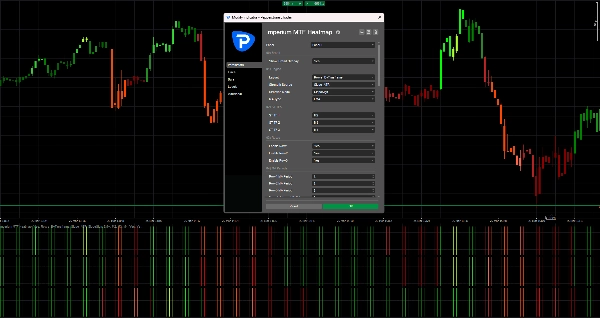
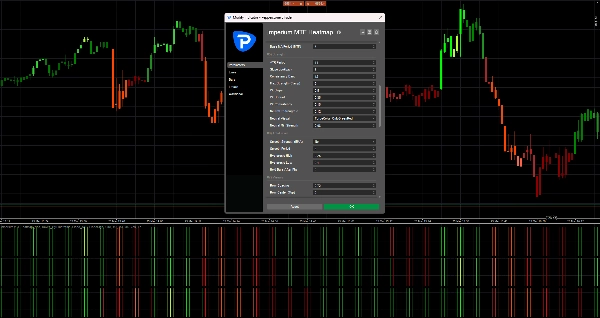
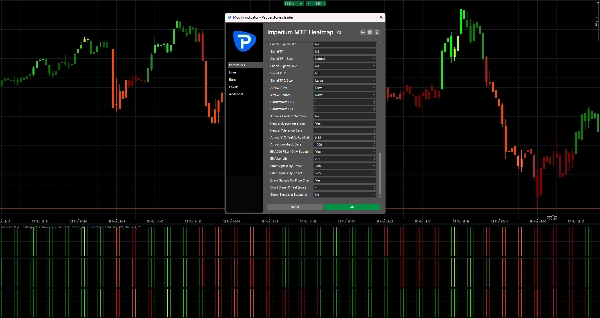
默认设置
默认设置针对:
- Tick30
- Minute1
这意味着该指标可立即用于快节奏交易环境,如剥头皮和短期日内交易。
默认结构:
- 第 1 行 = M2
- 第 2 行 = M3
- 第 3 行 = M4
这创建了一个紧凑的多时间框架视图,帮助您快速判断短期动量是否得到上层的支持。
如何读取指标
1. 先看第 1 行
第 1 行为您提供最快的短期方向和即时压力读取。
用第 1 行回答:
- 当前动量是多头还是空头?
- 市场现在是否有活跃压力?
- 走势强还是弱?
第 1 行是第一层信息,但不应总是单独交易。
2. 用第 2 行和第 3 行进行确认
第 2 行和第 3 行充当过滤器。
如果第 1 行变绿,但第 2 行和第 3 行仍为红色,走势可能较弱、过早或仅是短暂回调。
如果所有行都朝同一方向对齐,通常表示结构更强,交易质量更好。
一般规则:
- 1 行对齐 = 早期信号
- 2 行对齐 = 更强确认
- 3 行对齐 = 最高质量的方向一致性
最佳交易使用方式
多头设置
更强的多头设置是:
- 第 1 行为绿色
- 第 2 行为绿色
- 第 3 行为绿色
- 颜色强度稳定或增强
- 价格行为支持延续
这表明多头压力不是孤立的,而是得到整个热力图结构的支持。
空头设置
更强的空头设置是:
- 第 1 行为红色
- 第 2 行为红色
- 第 3 行为红色
- 颜色强度稳定或增强
- 价格行为支持下行延续
这表明空头控制,且短线入场或延续交易的概率更高。
实用交易方法
使用 Imperium MTF 热力图 的简单方法:
激进入场风格
入场条件:
- 第 1 行强烈翻转
- 第 2 行开始支持该走势
- 动量快速积累
这种风格提供更早的入场机会,但风险也更大。
保守入场风格
仅当满足以下条件时入场:
- 第 1 行、第 2 行和第 3 行对齐
- 颜色稳定且强烈
- 走势得到清晰价格行为支持
这种风格入场次数较少,但质量通常更好。
蜡烛颜色
该指标还可以根据热力图方向为蜡烛着色。
这帮助您:
- 视觉上保持与当前偏向一致
- 避免逆势交易
- 无需手动检查每行即可更快读取市场
默认设置下,蜡烛着色与 M2 关联,适合 Tick30 和 Minute1 图表的快速交易逻辑。
信号箭头
如果启用,信号箭头可以帮助突出潜在的买卖机会。
这些箭头并非用来替代市场解读。
它们与热力图对齐一起使用效果最佳。
最佳实践:
- 仅在整个热力图偏向方向上使用箭头
- 当第 2 行和第 3 行确认第 1 行时,赋予箭头更高价值
- 在混合或冲突的热力图条件下忽略箭头
在您当前的默认设置中,信号箭头被设置为 关闭,这保持了图表的整洁,并将焦点放在热力图本身。
应避免的事项
不要盲目使用该指标。
避免在以下情况下交易:
- 行混合不一致
- 颜色弱且不稳定
- 热力图方向快速变化
- 市场震荡或区间震荡
- 价格行为明显与热力图结构不符
该指标最强大的是作为 决策支持工具 使用,而非独立的自动入场系统。
最佳使用场景
Imperium MTF 热力图 对以下情况特别有效:
- 剥头皮交易
- 短期动量交易
- 趋势延续入场
- 回调确认
- 多时间框架汇聚分析
- 过滤弱势交易
- 保持与市场压力一致
为什么交易者持续使用它
该指标之所以强大,是因为它将大量重要的市场信息压缩成一个快速的视觉读取。
一旦您开始定期使用,您会注意到:
- 更快识别方向
- 更清晰识别强度
- 更自信识别对齐
- 更早识别弱势设置
- 在活跃市场中更好把握时机
这就是为什么它常常成为交易者一直保留在图表上的指标之一。
简单规则记住
绿色对齐 = 寻找买入
红色对齐 = 寻找卖出
混合热力图 = 等待
这一原则本身就使该指标非常实用。
摘要
Traders use the heatmap to quickly assess market direction, momentum quality, and alignment across multiple layers, aiding in identifying high-quality trade setups and filtering out weak or noisy conditions. The indicator supports both aggressive and conservative entry styles based on the alignment and strength of the heatmap rows. It can also color candles according to the dominant heatmap direction for faster market reading.
Optional signal arrows highlight potential buy and sell opportunities but are intended as a supplement to heatmap analysis rather than standalone signals. Imperium MTF Heatmap is particularly suited for scalping, short-term momentum trading, trend continuation, pullback confirmation, and multi-timeframe confluence analysis across various markets including Forex, indices, commodities, stocks, and cryptocurrencies. It functions as a decision support tool to enhance market awareness and timing in active trading environments.
客户评价
5 | 50 % | |
4 | 50 % | |
3 | 0 % | |
2 | 0 % | |
1 | 0 % |


