Description
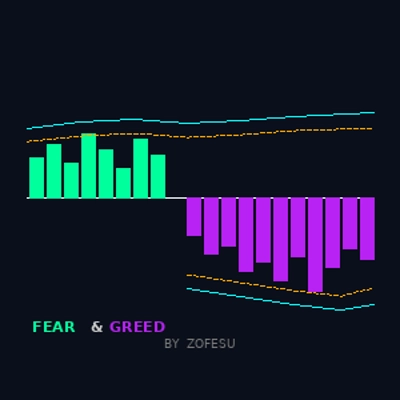
📊 Fear & Greed par Zofesu — Moteur VIX double | Détection du sentiment institutionnel
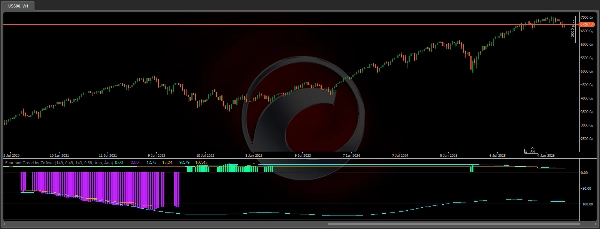
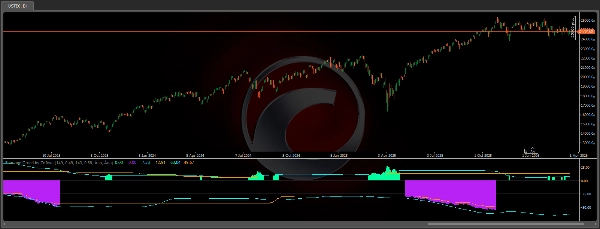
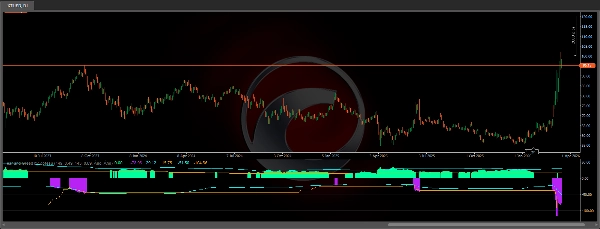
Fear & Greed est un oscillateur de précision construit sur un moteur Williams VIX Fix double — un calibré pour la panique (Fear), un pour l’euphorie (Greed). Il identifie les moments où la surchauffe institutionnelle atteint des niveaux statistiquement extrêmes, signalant des zones de retournement à haute probabilité.
⚙ COMMENT ÇA FONCTIONNE
L’indicateur exécute deux calculs WVF indépendants :
Moteur Fear — mesure à quelle distance le plus bas actuel est du plus haut cours de clôture récent. Les pics signalent la capitulation et la panique.
Moteur Greed — mesure à quelle distance le plus haut actuel est du plus bas récent. Les pics signalent une surextension euphorique.
Chaque moteur est filtré par deux seuils indépendants :
1. Limite supérieure/inférieure de la bande de Bollinger (2× Écart-type)
2. Seuil de rang percentile (configurable)
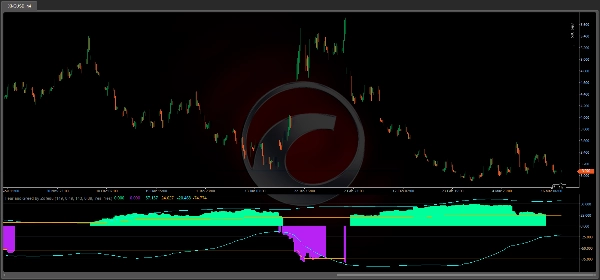
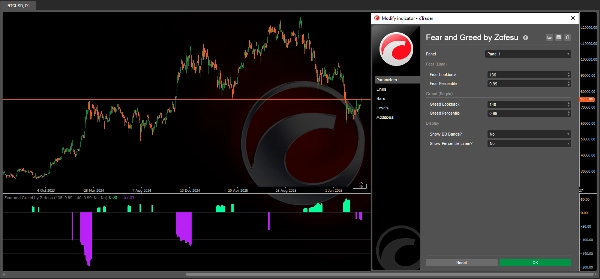
Une barre d’histogramme apparaît UNIQUEMENT lorsque le prix franchit LES DEUX ou L’UN des seuils — éliminant le bruit et ne montrant que les extrêmes statistiquement significatifs.
🔑CARACTÉRISTIQUES CLÉS
✅ Moteur WVF double — Fear (Vert citron) et Greed (Violet) calculés indépendamment avec des fenêtres de retour séparées
✅ Bandes BB — limites dynamiques de la bande de Bollinger pour chaque moteur
✅ Lignes de percentile — seuils de rang percentile configurables
✅ Sortie d’histogramme propre — barres visibles uniquement aux lectures extrêmes
✅ Toutes les 4 lignes de limite activables/désactivables indépendamment
✅ Entièrement configurable — retour et percentile séparés pour Fear et Greed
✅ Fonctionne sur tous les actifs et toutes les périodes
✅ C# léger — aucun impact sur la performance
📚COMMENT UTILISER
1. Ajoutez l’indicateur à n’importe quel graphique en tant que panneau séparé
2. Histogramme vert citron = pic Fear — zone potentielle de retournement haussier
3. Histogramme violet = pic Greed — zone potentielle de retournement baissier
4. Lignes aqua = limites BB pour chaque moteur
5. Lignes pointillées orange = seuils de percentile
6. Utilisez en confluence avec l’action des prix, les niveaux S/R, SuperTrend ou VWAP
7. Les périodes plus longues (D1, W1) produisent les signaux les plus fiables Meilleurs résultats sur : H1, H4, D1 Fonctionne sur : Indices (NAS100, SPX500), Crypto (BTCUSD), Forex, Or, Pétrole, Actions.
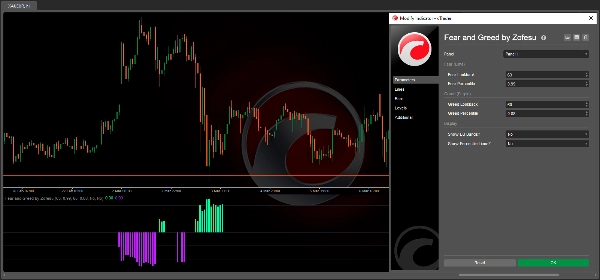
🔗PARAMÈTRES
Fear (Vert citron) :
- Lookback Fear — barres pour le calcul WVF et BB (par défaut 149)
- Percentile Fear — seuil de rang percentile (par défaut 0,49)
Greed (Violet) :
- Lookback Greed — barres pour le calcul WVF et BB (par défaut 143)
- Percentile Greed — seuil de rang percentile (par défaut 0,89)
Affichage :
- Afficher les bandes BB — activer/désactiver les lignes de limite aqua
- Afficher les lignes de percentile — activer/désactiver les lignes de seuil orange
🎯 GUIDE DE CALIBRATION (D’APRÈS L’EXPÉRIENCE)
Chaque actif et chaque période nécessite ses propres réglages uniques — l’indicateur est conçu pour permettre cette flexibilité.
Étape 1 — Trouver le bon Lookback :
Réglez d’abord le Percentile à 0,99, puis expérimentez avec la valeur Lookback entre 10 et 1000.
Un Lookback plus élevé réduit le bruit mais peut aussi masquer des signaux valides. La plage recommandée est de 50 à 500 pour la plupart des configurations.
Étape 2 — Affiner le Percentile :
Une fois que vous avez trouvé un Lookback qui vous convient, réduisez progressivement le Percentile à partir de 0,99 vers le bas. Cela assouplit le filtre et révèle des signaux supplémentaires. Les paramètres Fear et Greed n’ont pas besoin d’être identiques.
Étape 3 — Interprétation des signaux :
- La barre Fear disparaît sur une bougie fermée → entrée Long potentielle sur la bougie suivante.
- La barre Greed disparaît sur une bougie fermée → entrée Short potentielle sur la bougie suivante.
- Fear ou Greed allumé pendant plusieurs barres = le marché est en tendance ou accumule des positions — pas nécessairement un retournement.
- Fear et Greed allumés simultanément = pression conflictuelle. Vérifiez d’abord la période supérieure. Y a-t-il un niveau clé S/R à proximité ? Si oui, attendez une confirmation avant d’entrer.
Le nombre de signaux dépend entièrement de vous et de votre stratégie — des réglages plus stricts donnent moins d’entrées mais de meilleure qualité. Après avoir trouvé le bon réglage, vous pouvez désactiver les lignes dans les paramètres pour qu’elles ne vous dérangent pas.
⚠️ AVERTISSEMENT Le trading d’instruments financiers comporte un risque important de perte. Les performances passées d’un indicateur ou d’une stratégie ne garantissent pas les résultats futurs. Cet outil est fourni à des fins d’information et d’éducation uniquement. Utilisez toujours une gestion des risques appropriée et ne risquez jamais plus que ce que vous pouvez vous permettre de perdre. L’auteur n’est pas responsable des pertes de trading encourues par l’utilisation de cet indicateur.
Résumé
Avis clients
5 | 0 % | |
4 | 100 % | |
3 | 0 % | |
2 | 0 % | |
1 | 0 % |


![Logo de "[Stellar Strategies] MARSI Signal Plotter"](https://cdn.ctrader.com/image/webp/7b2b8da6-8f8e-4646-8d4a-4710c516c01e_25567)


