Description
Fonctionnalités :
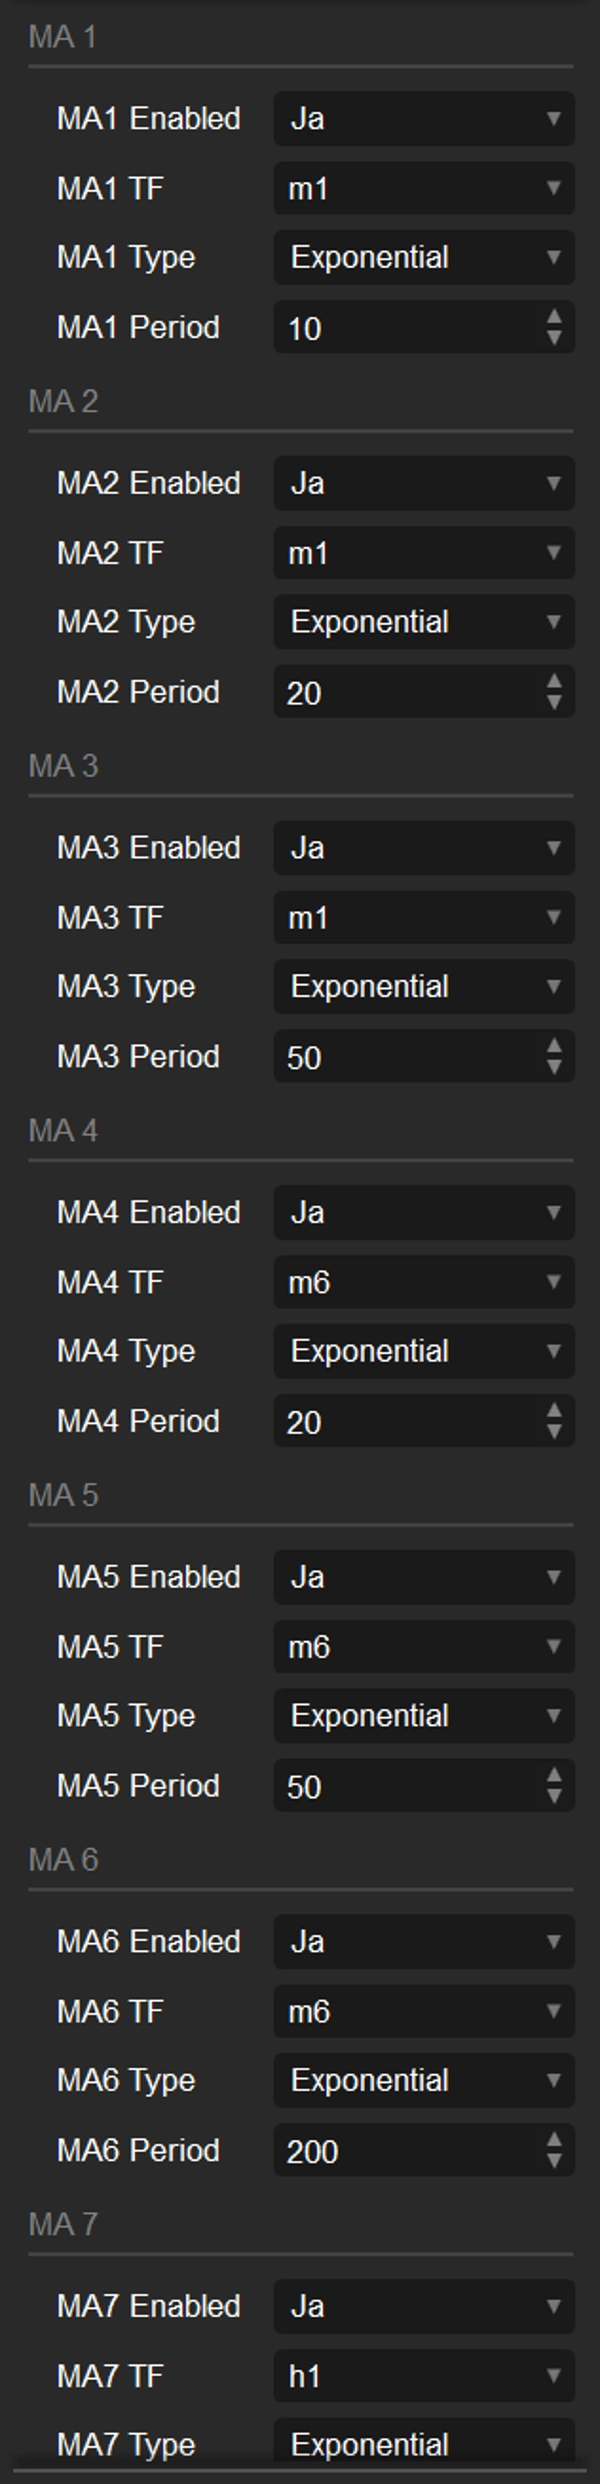
- Jusqu'à 9 moyennes mobiles avec TimeFrame, type et période individuels
- Types de MM pris en charge : SMA, EMA, WMA, LWMA, HMA
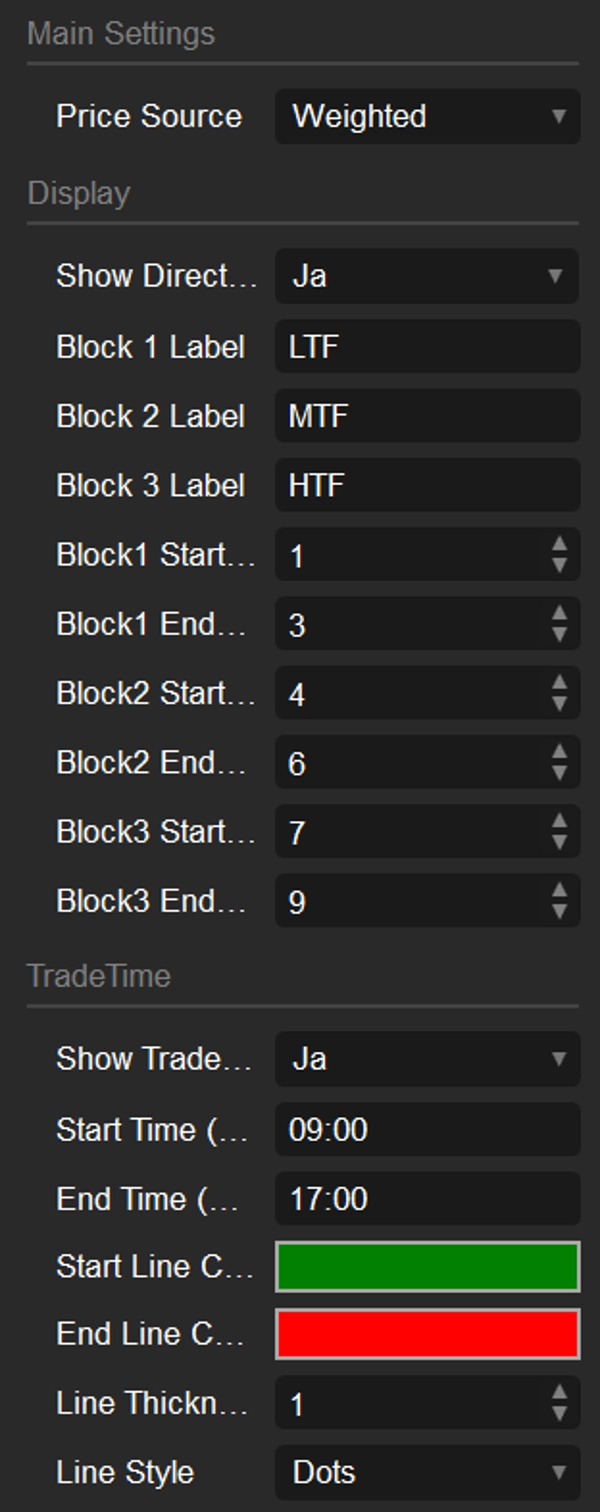
- Sources de prix prises en charge : Clôture, Ouverture, Haut, Bas, HL2, HLC3, OHLC4, Médiane, Typique, Pondéré
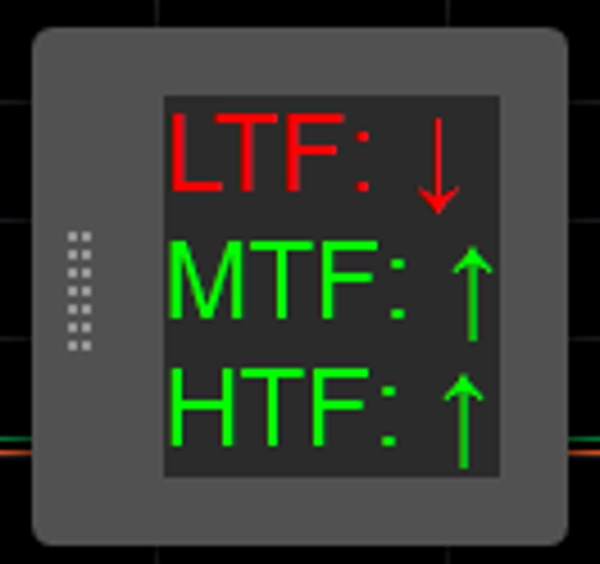
- Affiché directement sur le graphique (Superposition)
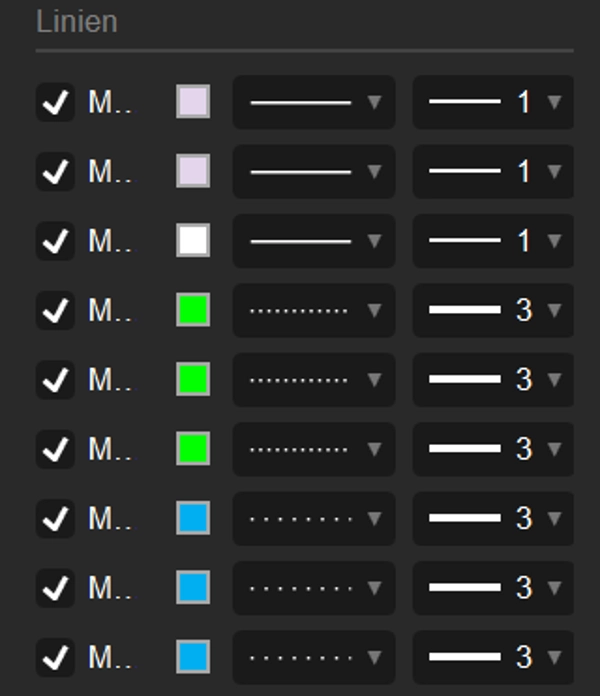
- Couleurs/styles/épaisseur des MM ajustables via l'onglet Lignes
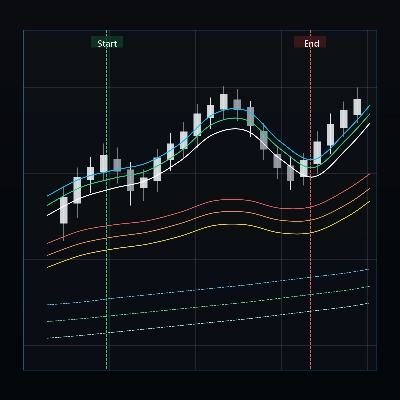
Fonctionnalité supplémentaire : lignes de session TradeTime
- Deux lignes verticales pour l'heure de début et de fin (HH:mm)
- Couleur, style de ligne et épaisseur entièrement personnalisables
- Peut être activé/désactivé via un paramètre
Version : V1.14 (Stable)
Remarques :
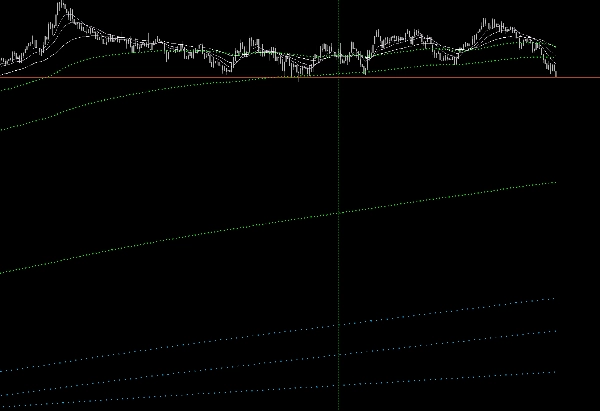
- Les MM HTF sont affichées par paliers par défaut (valeurs réelles)
-> Aucune interpolation appliquée pour préserver la précision
Résumé
Avis clients
5 | 0 % | |
4 | 100 % | |
3 | 0 % | |
2 | 0 % | |
1 | 0 % |


