Description
Dominator M4tr1x
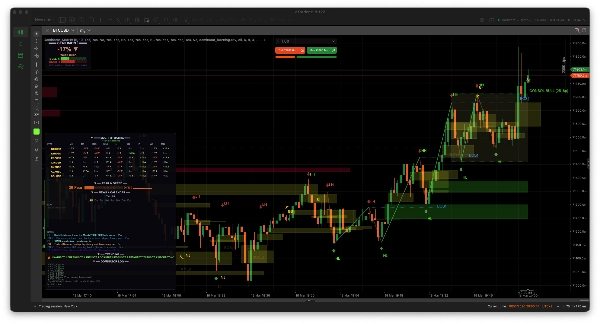
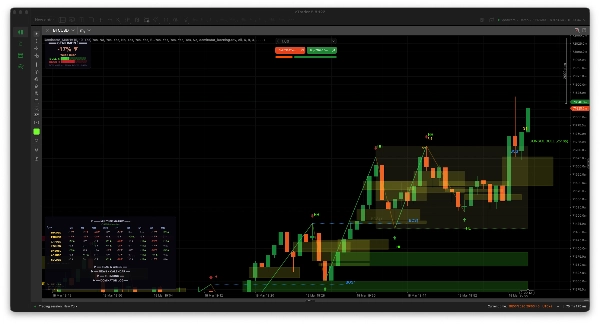
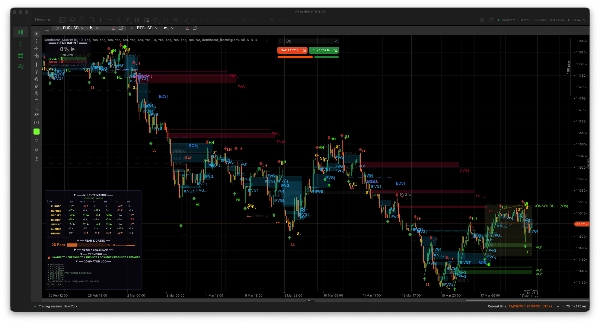
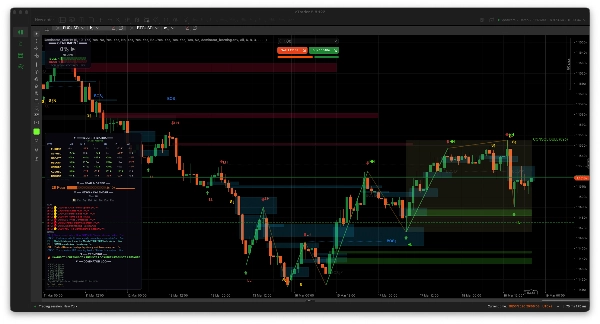
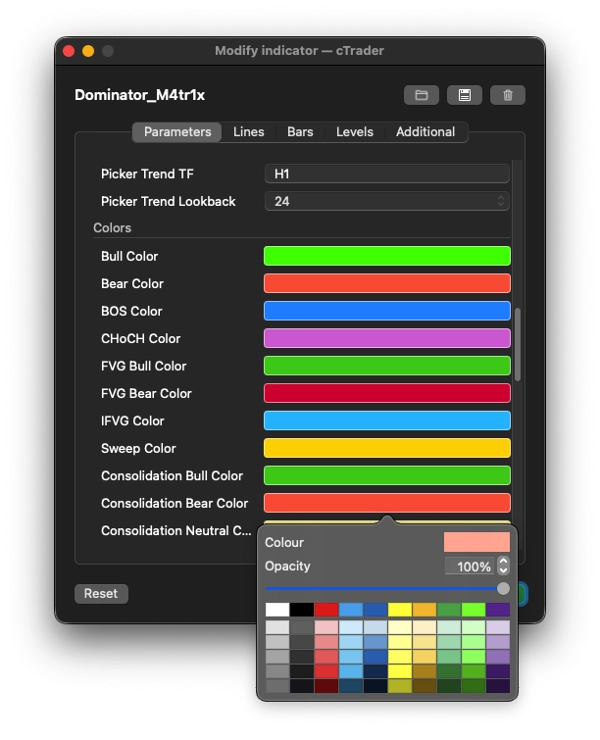
Ceci est un outil informatif basique qui combine l'analyse de la structure des prix smart-money sur le graphique avec plusieurs panneaux de tableau de bord d'informations. Voici une répartition de chaque système majeur :
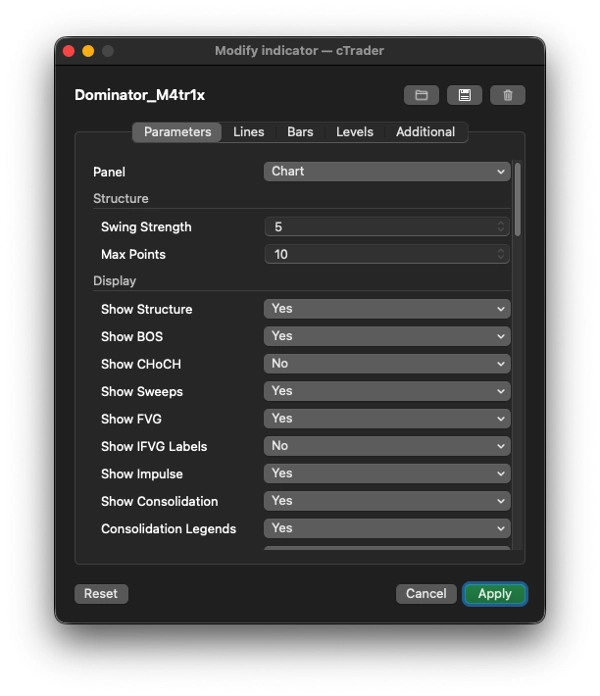
1. 📊 SUR LE GRAPHIQUE : Analyse de la structure Smart Money
Dessine directement sur le graphique des prix :
Fonctionnalité
Ce que ça fait ;
Détection de Swing
Identifie les hauts/bas de swing en utilisant une force de retour configurable, les marque avec des flèches (▲/▼)
Étiquettes de Structure
Étiquette chaque swing comme HH (Higher High), HL (Higher Low), LH (Lower High), LL (Lower Low) pour cartographier la structure du marché
BOS (Break of Structure)
Trace des lignes pointillées + étiquettes lorsque le prix casse un précédent haut/bas de swing dans la direction de la tendance
CHoCH (Change of Character)
Identique à BOS mais contre la tendance — signale un renversement potentiel de tendance
Invalidation de Cassure
Si le prix revient en arrière à travers un niveau BOS/CHoCH, il le marque comme échoué (gris avec ✗) et l'enregistre
Balayages de Liquidité
Détecte lorsque le prix fait une mèche au-dessus d'un haut de swing (ou en dessous d'un bas de swing) mais clôture à l'intérieur — un modèle classique de capture de liquidité
FVG (Fair Value Gaps)
Détecte les déséquilibres sur 3 chandeliers (écarts entre le haut du chandelier 1 et le bas du chandelier 3). Trace des rectangles colorés sur le graphique
IFVG (FVG Inversé)
Lorsque le prix revient combler un FVG, il le marque comme "IFVG" (l'écart devient une zone potentielle de support/résistance)
Invalidation de FVG
Si le prix clôture de manière décisive à travers une zone FVG, elle est marquée comme invalidée
Vagues d'Impulsion
Relie les points de swing avec des lignes de tendance — vert pour les jambes d'impulsion (avec la tendance), jaune pour les jambes correctives
Zones de Consolidation
Détecte lorsque des hauts et bas de swing consécutifs sont dans une plage étroite basée sur l'ATR, trace une boîte avec une étiquette "CONSOL BULL/BEAR/NEUTRAL" montrant l'orientation et la largeur en pips
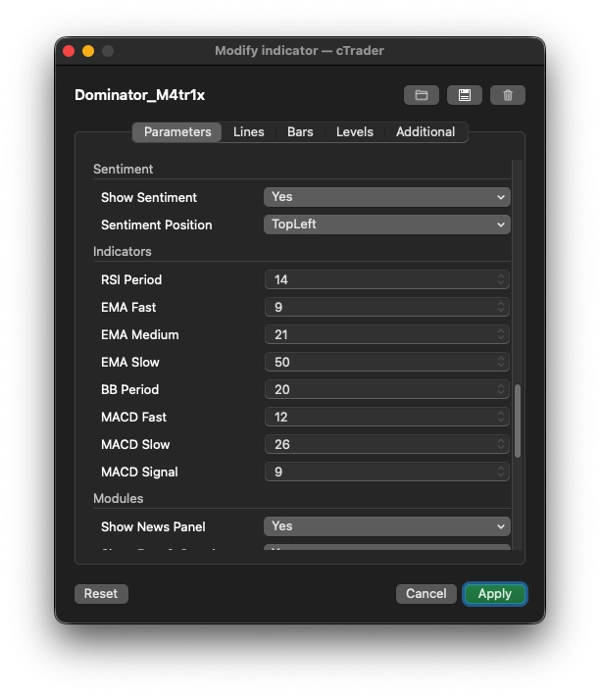
2. 📈 PANNEAU DE SENTIMENT (en haut à gauche par défaut)
Un indicateur de score taureau/ours en temps réel pour le symbole/intervalle de temps actuel du graphique utilisant :
- RSI (survendu/suracheté + détection de divergence)
- MACD (croisements, momentum de l'histogramme)
- 3 EMAs (alignement rapide/moyen/lent et position du prix par rapport à eux)
- Bandes de Bollinger (prix aux extrêmes des bandes supérieures/inférieures)
Affiche :
- Un score en pourcentage de -100% à +100% (ex., "+67% TAUREAU FORT")
- Barres de points visuelles taureau vs. ours (█████░░░░)
- Statistiques de signal en cours (total des signaux, confirmés, invalidés, % de précision)
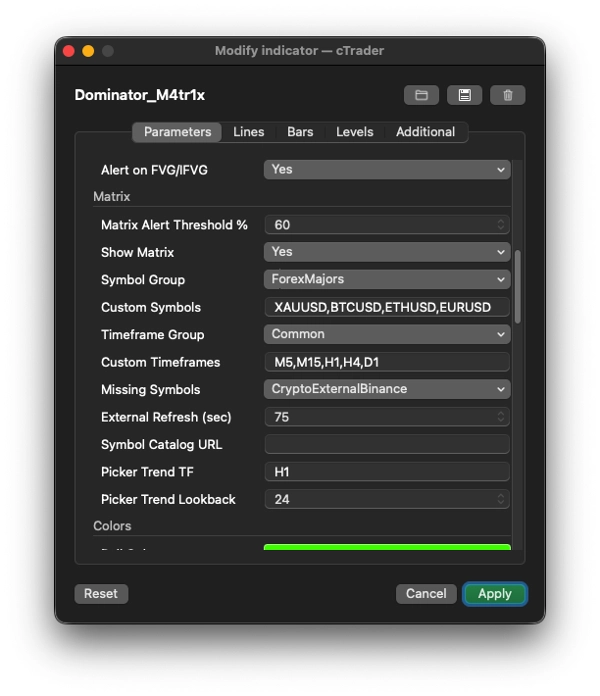
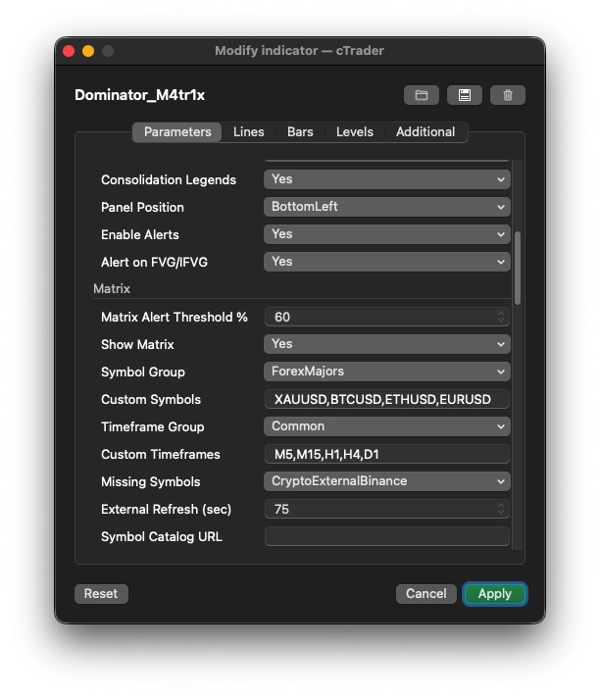
3. 🔢 MATRICE MULTI-TIMEFRAME (panneau principal)
Une grille/carte thermique affichant les scores de sentiment taureau/ours à travers plusieurs symboles × plusieurs intervalles de temps simultanément.
Aspect
Détails
Groupes de symboles
Forex Majors/Minors/Exotiques, Crypto, Indices, Actions US, Métaux, Énergie, Matières premières, ou Personnalisé
Groupes d'intervalles de temps
Commun (M5–W1), Tous, ou Personnalisé
Chaque cellule
Affiche un score codé par couleur comme "+42▲" (vert) ou "-67▼" (rouge) utilisant le même moteur de notation RSI/MACD/EMA/BB
Résolution des symboles
Extrêmement robuste — détecte automatiquement les conventions de nommage des brokers (suffixes comme .r, m, .cash, barres obliques comme EUR/USD), essaie des dizaines de permutations d'alias, met en cache les résultats
Données externes
Pour les symboles que le broker ne propose pas (surtout crypto), récupère les données OHLC depuis les APIs Binance, Bybit, OKX, Kraken, Bitfinex (gratuites, sans clé nécessaire)
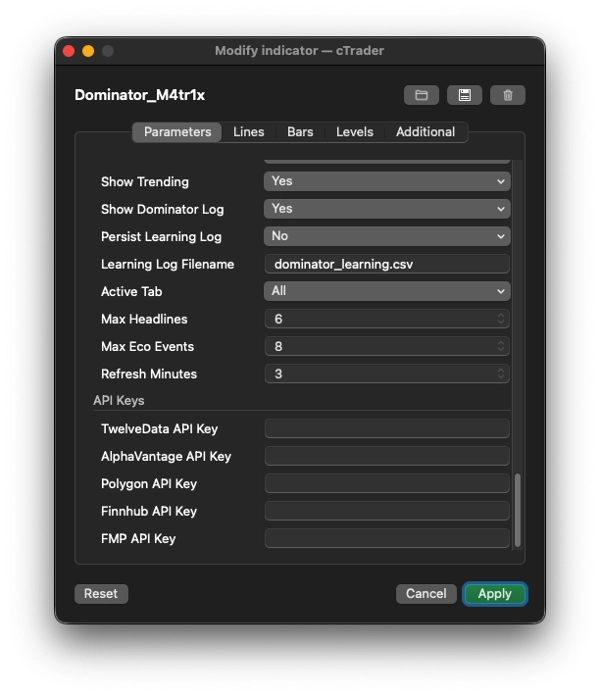
APIs Premium
Supporte optionnellement TwelveData, AlphaVantage, Polygon, Stooq pour actions/indices/forex via clés API
Interactif
Cliquez sur n'importe quel nom de symbole → ouvre un sélecteur de symbole consultable avec plus de 100 symboles dans toutes les catégories, affichant le changement % sur 24h. Cliquez sur n'importe quel en-tête d'intervalle de temps → ouvre un sélecteur d'intervalle de temps pour changer les colonnes
Alertes
Lorsqu'une cellule dépasse un seuil configurable (ex., ±60%), joue un son d'alerte
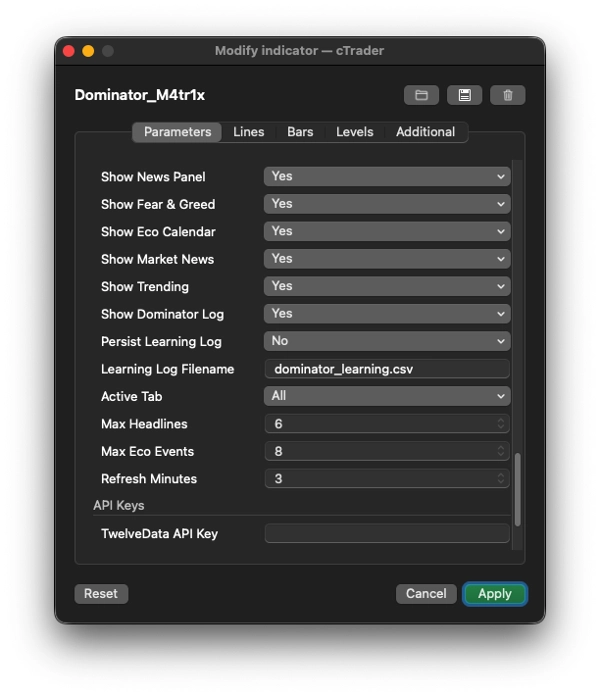
4. 📰 PANNEAUX D'ACTUALITÉS + D'INFORMATION
Calendrier économique
Agrège les événements économiques à fort/moyen impact à venir de 8+ sources redondantes :
- ForexFactory (JSON + XML), TradingView, Finnhub, TradingEconomics, MQL5, FXStreet, FMP (FinancialModelingPrep)
- Codé par couleur selon l'urgence (rouge = MAINTENANT, orange = <15 min, jaune = <1 heure, vert = plus tard)
Titres des actualités du marché
Agrège de 12+ sources RSS/API :
- Crypto : CryptoCompare, CoinDesk, CoinTelegraph, NewsBTC, annonces Binance, statut système OKX
- Forex : FXStreet, ForexLive
- Indices/Actions : MarketWatch, CNBC, Reuters, Yahoo Finance
- Catégorise automatiquement les titres (crypto/forex/métaux/énergie/actions) par détection de mots-clés
- Filtrable par onglet (Tous, Forex, Crypto, Métaux, Indices, Actions, Énergie, Économique)
Indice de Peur & Avidité
- Récupère l'Indice Crypto de Peur & Avidité (API alternative.me, avec repli sur CNN Business)
- Affiche la valeur numérique (0–100), l'étiquette (Peur Extrême → Avidité Extrême), la barre de couleur, et l'historique en sparkline sur 7 jours (▁▂▃▄▅▆▇█)
Tendances
- Récupère les principaux mouvements crypto du ticker 24h de Binance (top 5 gagnants + top 5 perdants)
- Repli sur les tendances CoinGecko ou CoinPaprika
5. 📝 JOURNAL DOMINATOR + SYSTÈME D'APPRENTISSAGE
- Garde un journal des signaux affichant les 8 derniers signaux avec statut (● actif, ✓ confirmé, ✗ invalidé)
- Suit les statistiques globales de précision (total des signaux, confirmations, invalidations, % de précision)
- Persistance CSV optionnelle : écrit chaque événement de signal (nouveau/confirmer/invalider) dans un fichier CSV (
dominator_learning.csv) avec métadonnées complètes — conçu pour alimenter un apprentissage machine futur ou des backtests
6. 🛠 Points forts de l'architecture technique
- Superposition complète (
IsOverlay = true) — dessine sur le graphique des prix, pas un panneau séparé - AccessRights = None — fonctionne dans le bac à sable du broker (pas d'accès au système de fichiers / réseau au-delà de ce que cAlgo permet)
- Récupération asynchrone des données — tous les appels HTTP s'exécutent sur des threads en arrière-plan via
Task.Run()pour ne jamais bloquer le graphique - Mise en cache intelligente — résolution des symboles, données OHLC externes, prix des tickers, et pourcentages de tendance sont tous mis en cache avec des intervalles de rafraîchissement configurables
- Nouvelle tentative automatique — les résolutions de symboles échouées et les récupérations de données externes réessaient toutes les 45 secondes
- Sections rétractables — chaque section de panneau (Matrice, Peur & Avidité, Actualités, Tendances, Journal) peut être repliée/dépliée en cliquant sur son en-tête
En résumé
Dominator M4tr1x est un indicateur informatif qui remplace un tableau de bord de trading complet. Il cartographie la structure smart-money sur le graphique (BOS, CHoCH, FVGs, balayages, consolidation), évalue le sentiment multi-actifs/multi-intervalles via des indicateurs techniques, agrège les calendriers économiques et les actualités du marché de plus de 20 sources, suit la Peur & Avidité, affiche les actifs en tendance, enregistre tous ses propres signaux avec suivi de précision, et vous permet d'échanger de manière interactive les symboles et intervalles de temps — tout en récupérant en arrière-plan les données manquantes de plus de 5 APIs d'échanges externes.
Résumé
The indicator includes a sentiment panel that scores bull/bear momentum using RSI, MACD, EMAs, and Bollinger Bands, presenting a real-time percentage score and signal statistics. A multi-timeframe matrix displays sentiment scores across various symbols and timeframes, supporting Forex, Crypto, Indices, Stocks, Metals, Energy, and Commodities. It fetches external OHLC data from multiple exchange APIs and supports premium data sources for broader market coverage.
Additional features include aggregated economic calendars and market news from over 20 sources, a Crypto Fear & Greed Index with historical trends, and trending asset lists. The Dominator Log tracks signal history and accuracy, with optional CSV export for further analysis. The interface offers interactive symbol and timeframe selection, alert notifications, and collapsible panels for customizable workflow.
Discussion
Avis clients
5 | 40 % | |
4 | 60 % | |
3 | 0 % | |
2 | 0 % | |
1 | 0 % |