Description
Previous HLOC – Niveaux intelligents à plus long terme pour un trading précis
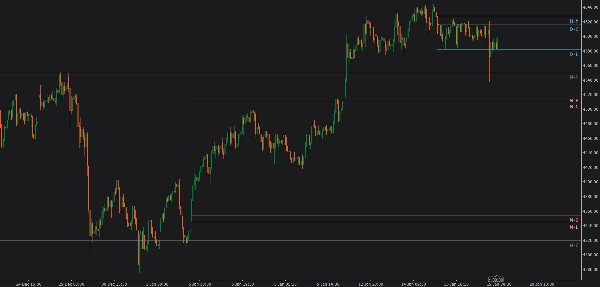
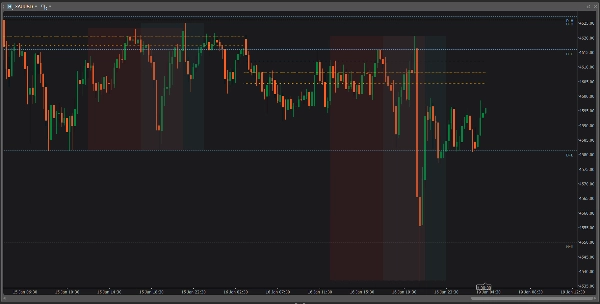
Previous HLOC est un indicateur professionnel multi-échelles qui trace les niveaux Haut, Bas, Ouverture et Clôture de la période précédente directement sur votre graphique avec une clarté et une personnalisation inégalées.
Conçu pour les traders en price-action, scalpers, traders intraday et swing traders, cet indicateur vous aide à identifier instantanément les niveaux institutionnels clés qui agissent souvent comme zones de support, résistance, rejet et cibles de liquidité.
Pourquoi Previous HLOC ?
Les marchés réagissent constamment aux niveaux du jour, de la semaine et du mois précédents. Les institutions, algorithmes et traders professionnels suivent ces niveaux de près.
Previous HLOC affiche ces prix critiques sur votre graphique de manière claire et sans distraction—pour que vous ne les manquiez jamais.
Caractéristiques clés
✅ Niveaux multi-échelles
- Choisissez les niveaux de la bougie quotidienne, hebdomadaire, mensuelle ou horaire
- Les niveaux restent précis quel que soit le timeframe de votre graphique
✅ Contrôle complet du HLOC
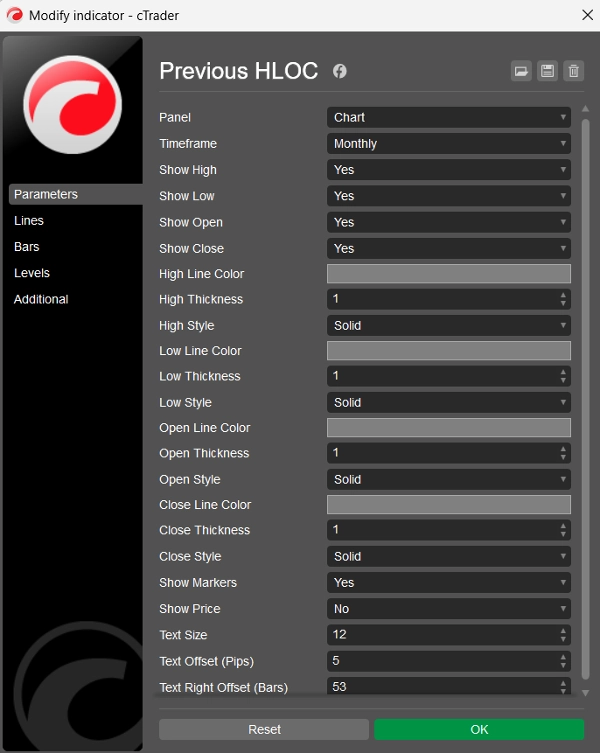
- Activez ou désactivez Haut, Bas, Ouverture, Clôture individuellement
- Tradez uniquement ce qui importe pour votre stratégie
✅ Personnalisation avancée
- Couleur, épaisseur et style de ligne séparés pour chaque niveau
- Marqueurs en police Consolas propre avec taille de texte ajustable
- Affichage optionnel du prix à côté de chaque marqueur
✅ Marqueurs flottants intelligents
- Les marqueurs se déplacent naturellement avec le graphique
- Toujours alignés avec le niveau de prix lors du défilement
- Positionnés sur la droite pour une visibilité claire
✅ Niveaux projetés dans le futur
- Les lignes s’étendent loin dans le futur
- Idéal pour planifier entrées, sorties, stop-loss et take-profit
🔹 Comment les traders l’utilisent
📌 Identifiez un support et une résistance intraday forts
📌 Utilisez le Haut/Bas précédent comme zones de balayage de liquidité
📌 Tradez les ruptures, rejets et retests
📌 Alignez les entrées avec la tendance des timeframes supérieurs
📌 Améliorez la précision risque-rendement
🔹 À qui s’adresse cet indicateur ?
✔ Traders Forex
✔ Traders d’indices et de matières premières
✔ Scalpers et traders journaliers
✔ Swing traders
✔ Traders en price-action et SMC
🔹 Propre. Rapide. Fiable.
- Pas de repaint
- Pas de latence
- Pas d’encombrement
- Fonctionne sur tous les symboles et tous les timeframes
🔹 Résumé
Previous HLOC n’est pas qu’un simple indicateur de niveaux—c’est un outil de trading professionnel qui vous aide à trader avec contexte, structure et confiance.
Si vous tradez autour des niveaux de la session précédente, cet indicateur doit figurer sur votre graphique.
Résumé
Key features include advanced customization options such as separate color, thickness, and line style settings for each level, adjustable Consolas font markers with optional price display, and smart floating markers that stay aligned with price levels and positioned for clear visibility. The indicator extends these levels far into the future, aiding in planning entries, exits, stop-loss, and take-profit points.
Designed for price-action traders, scalpers, intraday, and swing traders, Previous HLOC helps identify key institutional levels that often act as support, resistance, rejection zones, and liquidity targets. It is applicable across various markets including Forex, indices, commodities, stocks, and cryptocurrencies.
The indicator operates without repainting or lag and works on all symbols and timeframes, providing a clean and reliable tool for trading with context, structure, and precision.
Discussion
Avis clients
5 | 100 % | |
4 | 0 % | |
3 | 0 % | |
2 | 0 % | |
1 | 0 % |