
Description
Flux Gate Precision lit la plage dans laquelle le marché a réellement négocié, et vous indique quand le prix s'engage vers une extrémité de cette plage.
Comment il trouve un signal
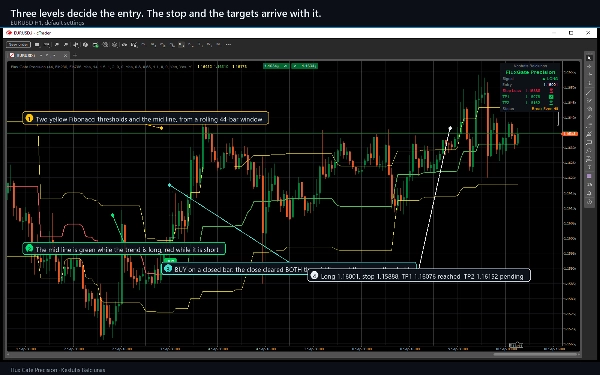
Une fenêtre glissante des 44 dernières bougies donne le plus haut maximum et le plus bas minimum. Trois niveaux sont mesurés à partir de ce plus haut : un seuil Fibonacci supérieur à 23,6 %, une ligne médiane à 50 % et un seuil inférieur à 78,6 %. L'indicateur trace les trois, et colore la ligne médiane en vert lorsque la tendance est haussière et en rouge lorsqu'elle est baissière.
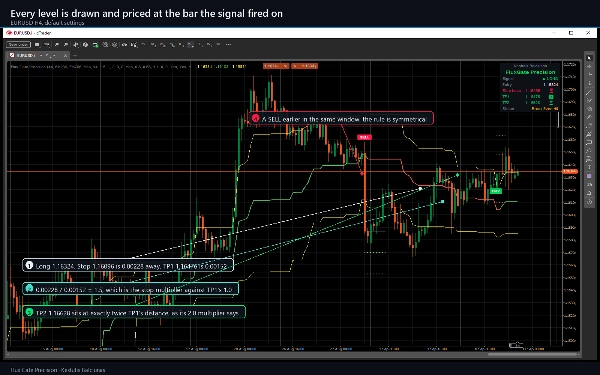
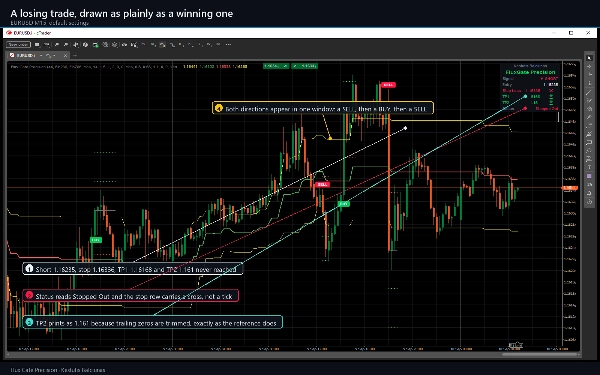
Un ACHAT nécessite qu'une barre clôture au-dessus à la fois de la ligne médiane et du seuil supérieur. Une VENTE nécessite une clôture en dessous à la fois de la ligne médiane et du seuil inférieur. Exiger deux niveaux plutôt qu'un permet de rester silencieux pendant que le prix oscille autour du milieu de la plage. Un état de tendance doit également changer : il n'imprimera pas un second ACHAT tant qu'une VENTE n'aura pas eu lieu, afin d'éviter un regroupement du même signal dans un seul mouvement.
Chaque décision est prise sur une barre FERMÉE. Un marqueur n'apparaît jamais puis ne disparaît.
Ce qui accompagne le signal
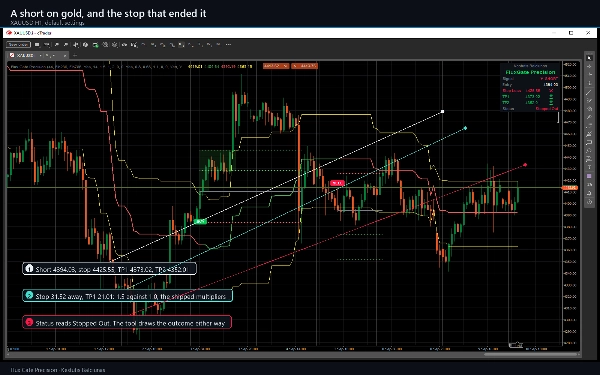
Au moment où un signal s'affiche, l'indicateur fixe une entrée, un stop et jusqu'à quatre prises de bénéfices, et trace chacune comme une ligne étiquetée portant son prix.
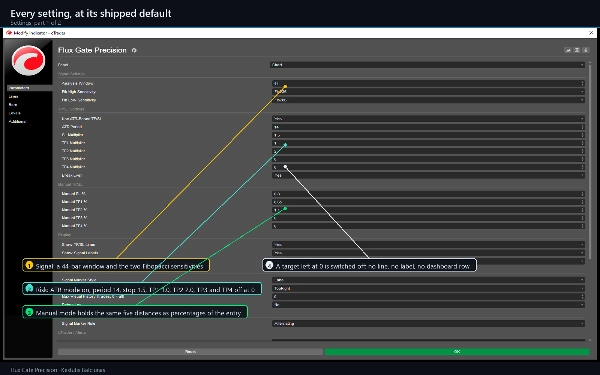
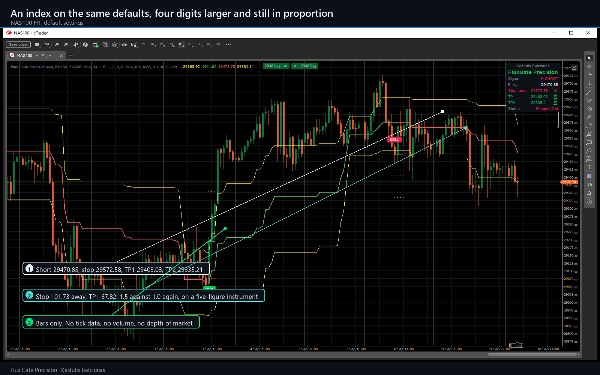
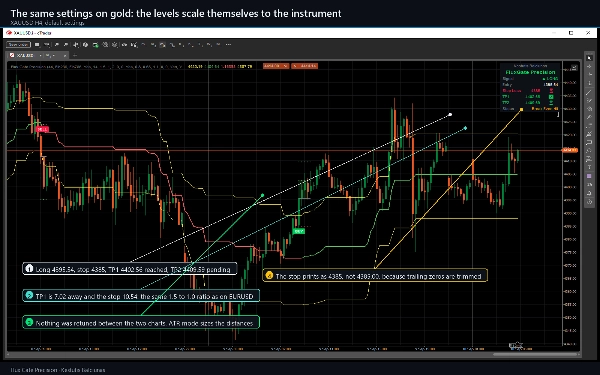
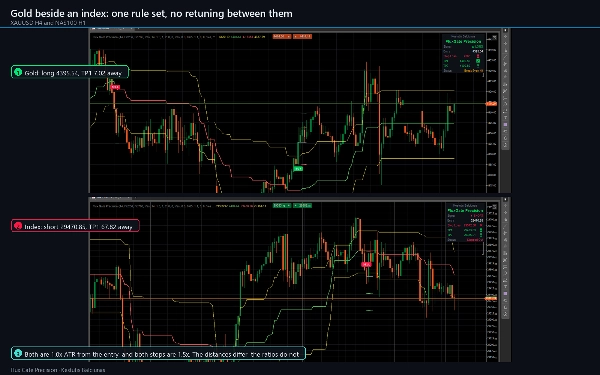
- Le mode ATR, activé par défaut, ajuste le stop et les objectifs en fonction de la volatilité actuelle, de sorte que les mêmes réglages se comportent de manière cohérente sur un graphique de cinq minutes comme sur un graphique journalier, et sur une paire de devises comme sur l'or.
- Le mode manuel les ajuste en pourcentage fixe du prix d'entrée à la place.
- Le stop est par défaut à 1,5 ATR, le premier objectif à 1,0 et le second à 2,0. Le troisième et le quatrième sont désactivés jusqu'à ce que vous leur donniez un multiplicateur.
L'échelle du seuil de rentabilité
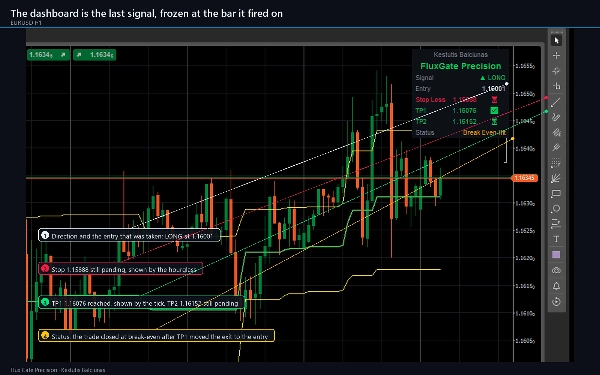
Avec le seuil de rentabilité activé, la sortie suit la transaction : atteindre le premier objectif déplace le stop à l'entrée, le second le déplace au premier objectif, le troisième au second, et atteindre le quatrième clôt la transaction. Une bande ombrée est dessinée chaque fois qu'un niveau est atteint, de sorte que toute la vie d'une transaction reste lisible sur le graphique par la suite.
Le tableau de bord
Un panneau dans le coin de votre choix affiche le dernier signal et ce qui lui est arrivé depuis : direction, entrée, stop, chaque objectif actif avec une coche lorsque le prix l'atteint, et une ligne d'état indiquant Actif, Tous les TP atteints, Stop Loss, Seuil de rentabilité atteint ou Changement de tendance.
Alertes
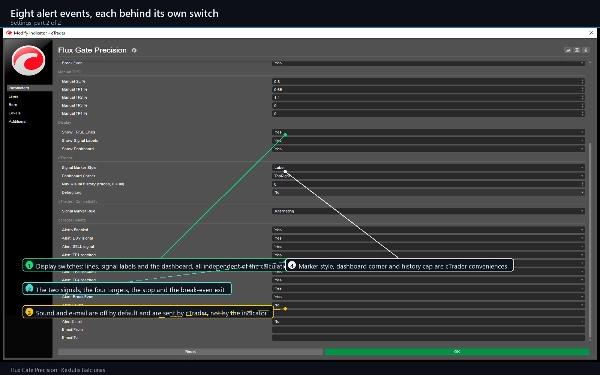
Huit événements, chacun derrière son propre interrupteur : les deux signaux, les quatre objectifs, le stop et la sortie au seuil de rentabilité. Chacun se déclenche une fois par barre fermée et jamais pour l'historique, donc l'attacher à un graphique long ne produit pas une avalanche d'anciennes alertes. La livraison se fait via le journal cTrader, un son optionnel, et un e-mail optionnel via vos propres paramètres cTrader.
Paramètres
38 paramètres en quatre groupes que vous utiliserez et trois que vous ne toucherez probablement pas : la fenêtre d'analyse et les deux sensibilités Fibonacci, le mode ATR et ses multiplicateurs, les pourcentages manuels, et trois interrupteurs d'affichage. Le reste sont des commodités cTrader : un style de marqueur, le coin du tableau de bord, un plafond d'historique visuel, un journal de débogage, et un interrupteur par alerte.
Type, périodes et instruments
Un indicateur superposé pour l'analyse de tendance et de support et résistance. Il nécessite environ 60 barres avant de dessiner, ce qui est court, donc il est utilisable sur des graphiques intrajournaliers ainsi que sur des graphiques de swing. M15, H1 et H4 sont la fenêtre autour de laquelle il a été conçu ; il fonctionne sur n'importe quelle période et n'importe quel instrument, et a été vérifié sur les principales paires FX, l'or et les indices. Il utilise uniquement des barres : pas de données tick, pas de volume, pas de profondeur de marché.
Pour qui c'est
Les traders qui veulent une règle d'entrée qu'ils peuvent énoncer en une phrase, et qui veulent que le stop et les objectifs soient décidés au même moment que l'entrée plutôt qu'après.
L'essai
L'édition d'essai est cette même version avec une restriction : elle fonctionne uniquement sur EURUSD, et les suffixes de courtier tels que EURUSD.i sont acceptés. Il n'y a pas de limite de temps et tous les paramètres sont disponibles. La version complète ajoute tous les autres symboles.
Notes techniques
Les signaux ne se repeignent pas : ils sont évalués uniquement sur des barres fermées. Pendant qu'une transaction est ouverte, ses lignes de niveau et leurs étiquettes s'étendent vers la droite avec le graphique, ce qui déplace le dessin, pas les niveaux. Pendant les premières barres de la fenêtre ATR, le stop et les objectifs restent au prix d'entrée jusqu'à ce que la moyenne ait suffisamment de données, et un objectif laissé à un multiplicateur zéro est désactivé et ne reçoit ni ligne, ni étiquette, ni ligne dans le tableau de bord.
L'indicateur ne déclare aucun droit d'accès. Il n'ouvre aucune connexion réseau, ne lit aucun fichier, et ne place, modifie ni ne ferme jamais d'ordre. Les coches sur le tableau de bord enregistrent que le prix a touché un niveau tracé sur l'historique chargé, sans spread, commission ni glissement.
Support
Les questions passent par l'onglet Discussion de cette fiche. Veuillez inclure votre symbole, période, courtier, version cTrader et une capture d'écran avec le tableau de bord visible.
Le trading comporte des risques. Les performances passées ne garantissent pas les résultats futurs.
Résumé
Upon signal generation, the indicator sets entry, stop-loss, and up to four take-profit levels, which are displayed as labeled lines on the chart. The stop and targets can be sized using ATR-based volatility or fixed percentage modes. The break-even ladder adjusts the stop progressively as targets are reached, visually marking each level on the chart.
A dashboard panel shows the latest signal status, including entry, stop, targets, and trade progress. Alerts can be configured for signals, targets, stops, and break-even exits, firing once per closed bar. The indicator works on any timeframe and instrument using bar data only and is suitable for intraday and swing trading. It has been tested on major FX pairs, gold, and indices.