
Description
H Capital Liquidity Map Lite est un outil de cartographie gratuit conçu pour les traders qui veulent de la structure sans encombrement.
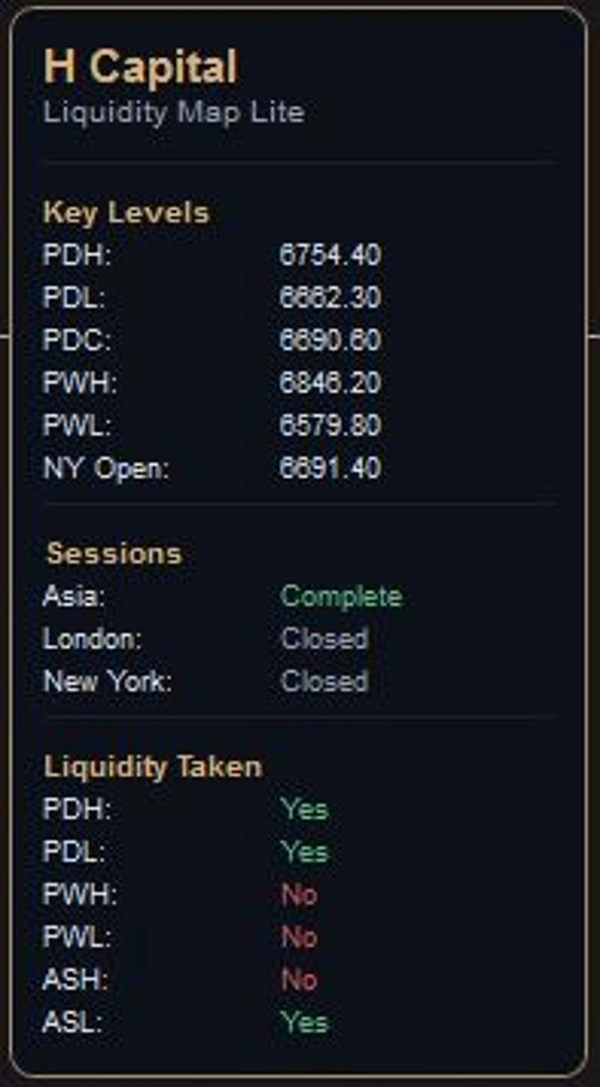
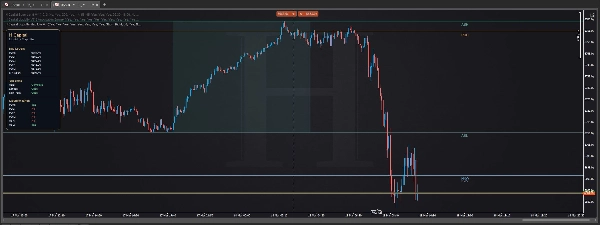
Il cartographie les références clés du marché que de nombreux traders surveillent chaque jour :
- plus haut du jour précédent
- plus bas du jour précédent
- clôture du jour précédent
- plus haut de la semaine précédente
- plus bas de la semaine précédente
- ouverture de New York
- plage de la session asiatique
- statut de la liquidité prise
L'objectif est simple : offrir aux traders un cadre clair avant l'exécution.
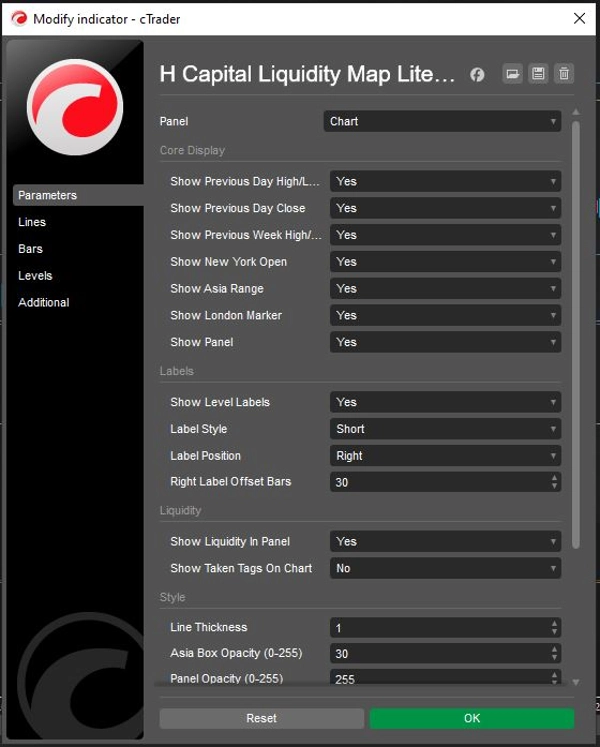
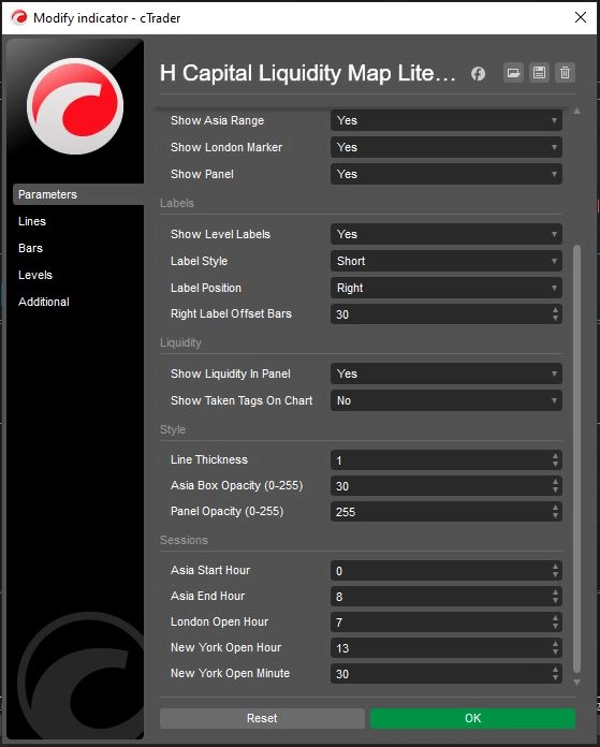
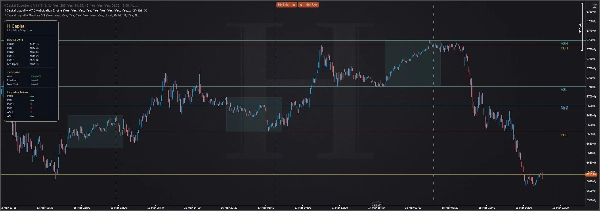
Plutôt que de saturer le graphique de signaux, H Capital Liquidity Map Lite se concentre sur les niveaux et les références de session qui aident à construire le contexte. L'interface est conçue dans un style minimaliste premium afin que le graphique reste lisible tout en gardant l'information accessible d'un coup d'œil.
Idéal pour :
- traders d'indices
- traders forex
- traders de métaux
- traders basés sur la liquidité
- traders qui préfèrent des graphiques épurés
Ce qu'il fait :
- cartographie les niveaux clés de liquidité journaliers et hebdomadaires
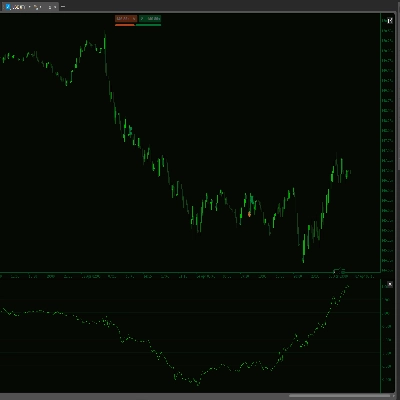
- affiche la structure des sessions
- suit si les niveaux importants ont été pris
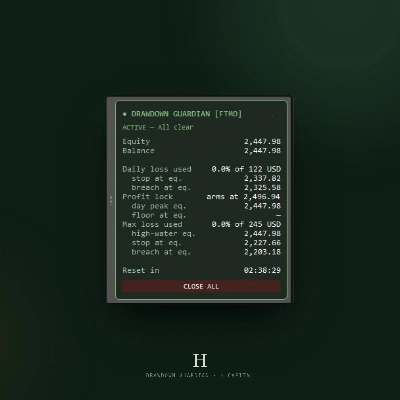
- garde l'information organisée via un panneau premium sur le graphique
Ce qu'il ne fait pas :
- ne génère pas de signaux d'achat/vente
- ne remplace pas le jugement d'exécution
- ne fonctionne pas comme un moteur d'alerte
Ce n'est pas un outil de signal. C'est une carte professionnelle du marché.
Résumé
This indicator is suited for traders in indices, forex, metals, and those focusing on liquidity-based strategies who prefer clean chart layouts. It helps build market context by mapping session structures and tracking whether significant levels have been breached. The tool does not generate buy or sell signals, replace execution judgment, or function as an alert system. Instead, it serves as a professional market map to support informed trading decisions.


![Logo de "[Hamster-Coder] Bollinger Bands"](https://cdn.ctrader.com/image/webp/21d8e5d6-fb11-4bac-b9ee-cd05c2b76804_30327)


