
PIVOT POINTS, HIGH-LOW OF THE DAY
Chỉ báo
108 lượt tải
Phiên bản 1.0, Mar 2026
Windows, Mac

60
Lượt bán
306
Cài đặt miễn phí
Mô tả
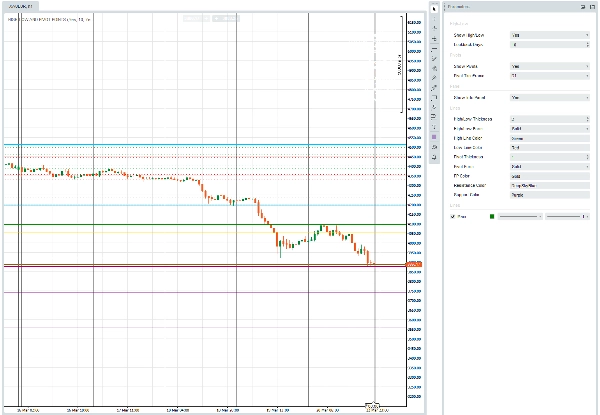
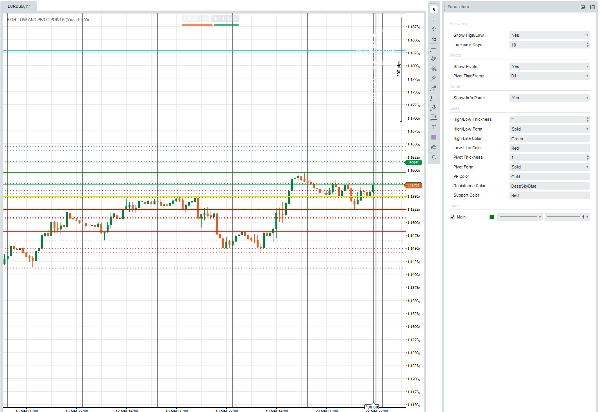
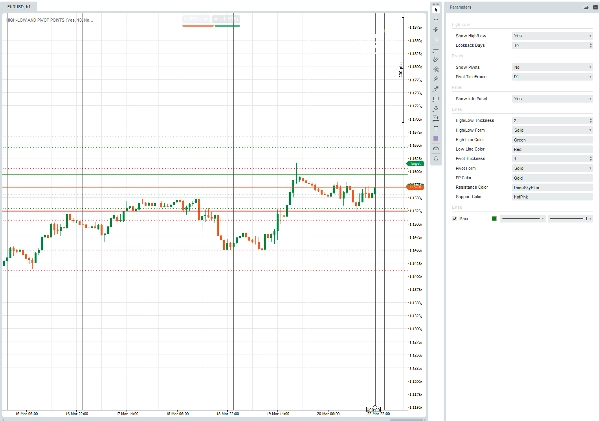
HIGH-LOW VÀ CÁC ĐIỂM PIVOT là một chỉ báo phủ cTrader vẽ các mức giá cao/thấp hàng ngày và các điểm pivot cổ điển trực tiếp trên biểu đồ của bạn.
Các tham số tổng quan:
NhómNhững gì bạn kiểm soát
High-Low
Hiện/ẩn các đường; số ngày trước để hiển thị (Lookback Days)
Pivots
Hiện/ẩn các đường; khung thời gian nào điều khiển việc tính toán pivot (Hàng ngày, Hàng tuần, v.v.)
Panel
Hiện/ẩn hộp thông tin trên biểu đồ liệt kê giá hiện tại và các mức pivot
Lines
Độ dày, kiểu (Đặc / Chấm / Rất chấm), và màu sắc cho các đường High, Low, PP, Resistance, và Support
Những gì nó vẽ:
- Mức Cao/Thấp hôm nay với màu bạn chọn; các ngày trước đó trong phiên bản nhẹ hơn/mỏng hơn của cùng màu.
- Bảy mức pivot tiêu chuẩn — PP, R1–R3, S1–S3 — được tính từ thanh hoàn thành trước đó của khung thời gian pivot bạn chọn.
- Một bảng thông tin góc trên bên phải tóm tắt mức Cao/Thấp ngày hiện tại, phạm vi nhìn lại nhiều ngày, và tất cả bảy mức giá pivot.
Tóm tắt
AI summary
The "Pivot Points, High-Low of the Day" indicator for cTrader overlays daily high and low price levels along with classic pivot points directly on trading charts. It visually displays today's high and low prices, as well as those from prior days based on a configurable lookback period. The indicator calculates and plots seven standard pivot levels—Pivot Point (PP), Resistance levels R1 to R3, and Support levels S1 to S3—derived from the previous completed bar of a selectable timeframe (e.g., daily or weekly). Users can customize visibility, line thickness, style (solid, dotted, very dotted), and colors for all lines including high, low, pivot, resistance, and support. An optional on-chart info panel summarizes live day high/low, multi-day range, and all pivot prices for quick reference. This tool supports multiple markets and symbols including Forex pairs (EURUSD, GBPUSD, NZDUSD, USDJPY), cryptocurrencies (BTCUSD), commodities (XAUUSD), indices (NAS100), and stocks. It is designed to assist traders in identifying key price levels and potential breakout or reversal points based on historical price data and pivot calculations.
Hồ sơ chỉ báo
Đánh giá của khách hàng
0.0
Đánh giá: 0
Đánh giá của khách hàng
Sản phẩm này chưa có đánh giá nào. Bạn đã dùng thử chưa? Hãy là người đầu tiên chia sẻ với mọi người!
Thảo luận
Câu hỏi thường gặp
BTCUSD
Forex
Breakout
Indices
EURUSD
Commodities
GBPUSD
NZDUSD
Crypto
Stocks
XAUUSD
NAS100
USDJPY
Các sản phẩm có sẵn trên cTrader Store, bao gồm bot giao dịch, chỉ báo và plugin, được cung cấp bởi các nhà phát triển bên thứ ba và chỉ nhằm mục đích cung cấp thông tin và tiếp cận kỹ thuật. cTrader Store không phải là nhà môi giới và không cung cấp lời khuyên đầu tư, khuyến nghị cá nhân hay bất kỳ đảm bảo nào về hiệu suất trong tương lai.














![Logo "[Stellar Strategies] BOS Trend 1.0"](https://cdn.ctrader.com/image/webp/6cdec0f1-0e97-4a82-a8a4-2b67aed54d38_25695)












Giá
60
Lượt bán
306
Cài đặt miễn phí