
Mô tả
Chỉ báo cTrader này xác định và trực quan hóa đầu tiên các mất cân bằng thị trường cụ thể xảy ra trong ba phiên giao dịch chính của New York. Nó được thiết kế cho những người thực hành ICT (Inner Circle Trader) tập trung vào các thiết lập "được trình bày đầu tiên" như dấu chân tổ chức có xác suất cao.
核心 (Core) Functionality
Chỉ báo theo dõi thị trường bắt đầu từ lúc mở phiên và "khóa" mất cân bằng đầu tiên mà nó tìm thấy. Khi một loại mất cân bằng (như FVG) đã được vẽ cho một phiên cụ thể, nó sẽ không vẽ loại đó nữa cho đến khi phiên tiếp theo bắt đầu.
1. Các loại mất cân bằng được phát hiện
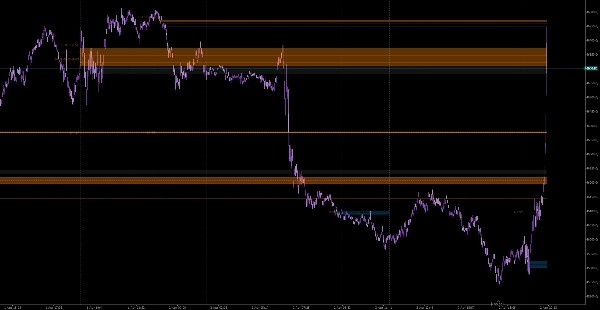
- Fair Value Gap (FVG): Cấu trúc ba nến trong đó bóng nến đầu tiên và bóng nến thứ ba không chồng lên nhau, để lại một "khoảng trống" tại phạm vi giá của nến thứ hai.
- Volume Imbalance (VI): Xảy ra khi có khoảng cách giữa thân nến (Mở/Đóng) của hai cây nến liên tiếp, ngay cả khi bóng nến chồng lên nhau.
- Liquidity Void (LV): Một khoảng cách cực đoan hơn khi không có hoạt động giá nào giữa bóng của hai cây nến liên tiếp (một "nhảy" giá hoàn toàn).
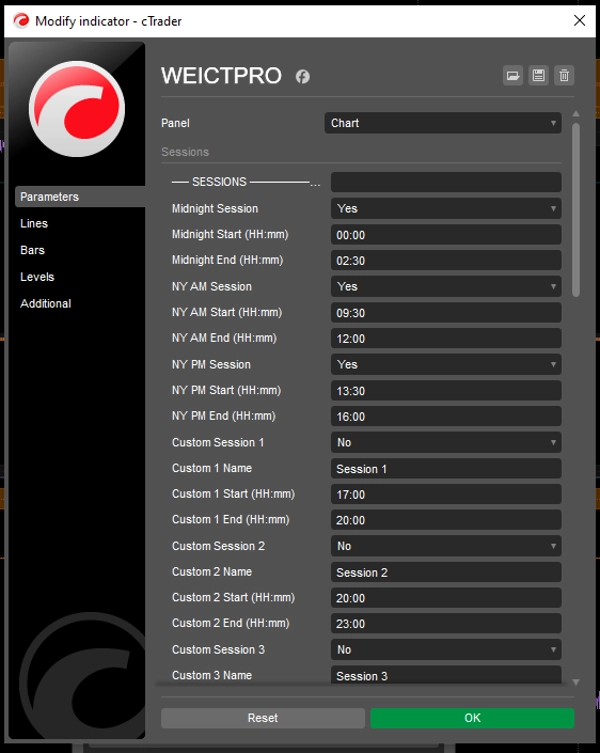
2. Các phiên được theo dõi (Giờ New York)
Chỉ báo tự động chuyển đổi thời gian biểu đồ của bạn sang Giờ Miền Đông (ET) để theo dõi:
- Nửa đêm: 00:00 – 02:30
- NY AM: 09:30 – 12:00
- NY PM: 13:30 – 16:00
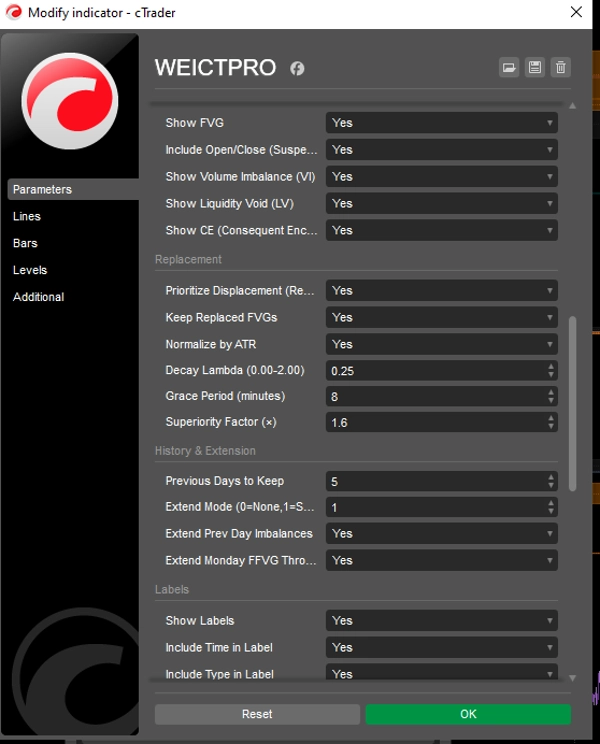
Tính năng trực quan
- Mở rộng động: Các hộp được vẽ từ điểm xuất phát và tự động mở rộng về phía trước theo số thanh do người dùng định nghĩa (
Extend Bars) để hiển thị hỗ trợ/kháng cự tiềm năng trong tương lai. - Xâm nhập tiếp theo (CE): Vẽ một đường giữa nét đứt qua mất cân bằng. Trong lý thuyết ICT, mức 50% (CE) là điểm tham chiếu quan trọng của tổ chức.
- Gắn nhãn tự động: Đánh dấu rõ ràng mỗi hộp với tên phiên và loại mất cân bằng (ví dụ, "NY AM +FVG").
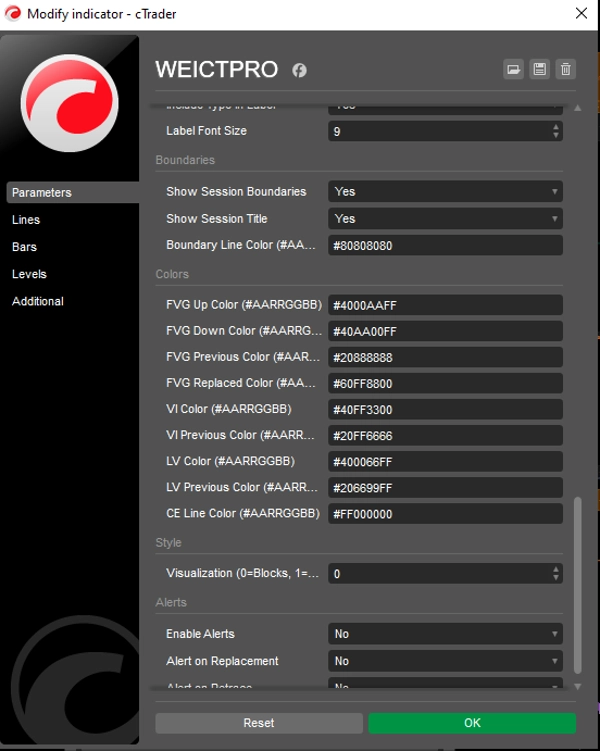
Các tham số chính
Tham số
Mô tả
Hiển thị FVG/VI/LV
Chuyển đổi loại mất cân bằng cụ thể mà bạn muốn theo dõi.
Độ mờ hộp
Điều chỉnh mức độ "đậm đặc" của các vùng được tô bóng trên biểu đồ của bạn.
Extend Bars
Bao nhiêu cây nến vào tương lai mà hộp nên chiếu dự báo.
Múi giờ
Được mã hóa cứng sang Giờ Chuẩn Miền Đông để đảm bảo độ chính xác phiên bất kể thời gian máy chủ của nhà môi giới bạn.
Khuyến nghị kỹ thuật
- Khung thời gian: Tốt nhất sử dụng trên M1 đến M15. Trên các khung thời gian cao hơn (H1+), các phiên quá ngắn để có thể bắt được mất cân bằng "đầu tiên" một cách đáng tin cậy.
- Cách sử dụng: Những vùng này thường hoạt động như "nam châm" cho giá. Nhà giao dịch tìm kiếm giá quay trở lại các hộp này (đặc biệt là mức CE) để vào lệnh trước khi tiếp tục theo hướng ban đầu.
Tóm tắt
The indicator detects three imbalance types: Fair Value Gap (FVG), a three-candle gap where the first and third candle wicks do not overlap; Volume Imbalance (VI), a gap between the bodies of two consecutive candles; and Liquidity Void (LV), a total price jump with no price action between consecutive candle wicks. Once an imbalance type is identified in a session, it locks and does not redraw until the next session.
Visual features include dynamically extending boxes from the imbalance origin for a user-defined number of bars, a dashed midline marking the 50% level (Consequent Encroachment), and automated labeling with session and imbalance type. The indicator is hardcoded to Eastern Time for session accuracy and is best used on M1 to M15 timeframes to reliably capture the first imbalance. Users can toggle imbalance types, adjust box opacity, and set extension length. This tool supports multiple markets including Forex, indices, commodities, stocks, and cryptocurrencies.


![Logo "Tabajara corrigido[fix]"](https://cdn.ctrader.com/image/webp/7f4bbef8-b245-4ebd-80d7-582fffc0c90c_28378)
