
Description
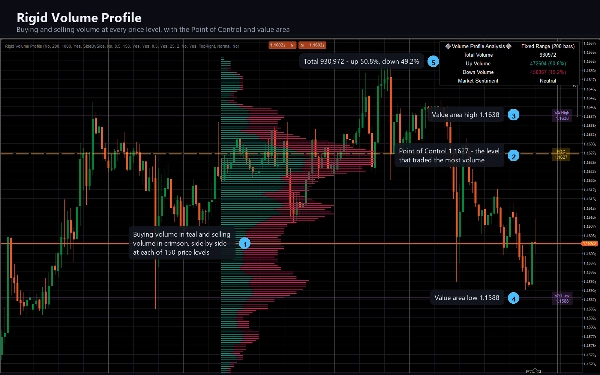
Le profil de volume rigide divise votre fenêtre de retour en un nombre fixe de niveaux de prix et montre combien de volume a été échangé à chacun, réparti entre pression d'achat et de vente.
CE QU'IL DESSINE
Un histogramme horizontal à côté de l'action des prix, construit à partir des N dernières barres. La barre de chaque niveau est divisée en volume haussier (des barres qui ont clôturé en hausse) et volume baissier (des barres qui ont clôturé en baisse), vous permettant de voir non seulement où le trading a eu lieu mais aussi quel camp l'a effectué. Les barres qui ont clôturé inchangées répartissent leur volume également entre les deux.
Une ligne en pointillés du Point de Contrôle marque le niveau de prix qui a échangé le plus de volume dans la fenêtre, étiquetée avec son prix exact.
Deux lignes de zone de valeur délimitent les niveaux qui représentent 70 % du volume de la fenêtre, chacune étiquetée.
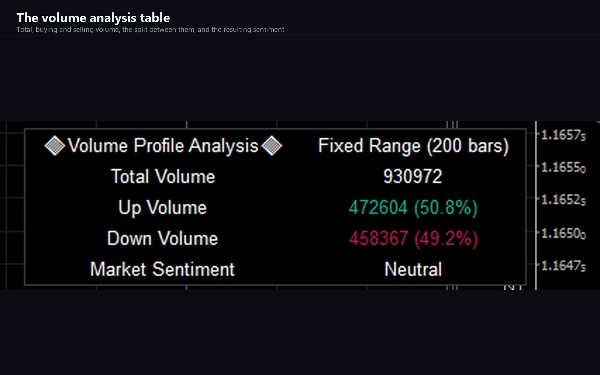
Un tableau d'analyse de volume rapporte le volume total, à la hausse et à la baisse avec les pourcentages, ainsi qu'une lecture du sentiment basée sur le camp dominant.
COMMENT L'UTILISER
Les profils de volume décrivent où le trading a réellement eu lieu, plutôt que où le prix s'est simplement déplacé. Un niveau qui a absorbé beaucoup de volume est un niveau qui intéresse de nombreux participants ; une partie mince du profil est une plage de prix que le marché a traversée rapidement.
Considérez le Point de Contrôle comme le centre de gravité de la fenêtre. Considérez la zone de valeur comme la plage où la majorité des transactions ont eu lieu. Considérez un écart mince entre deux nœuds lourds comme une zone que le prix a tendance à traverser plutôt qu'à y rester. Observez quel côté de la division domine un niveau lorsque le prix y revient.
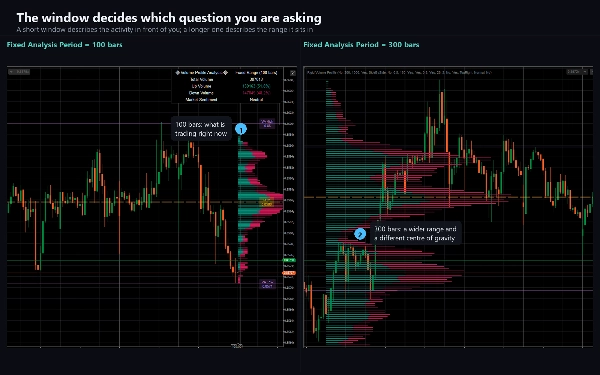
La fenêtre est à votre choix et l'image change avec elle, choisissez donc une période de retour qui correspond à la décision que vous prenez. Un profil de 100 barres répond à une question différente d'un profil de 500 barres.
PARAMÈTRES CLÉS
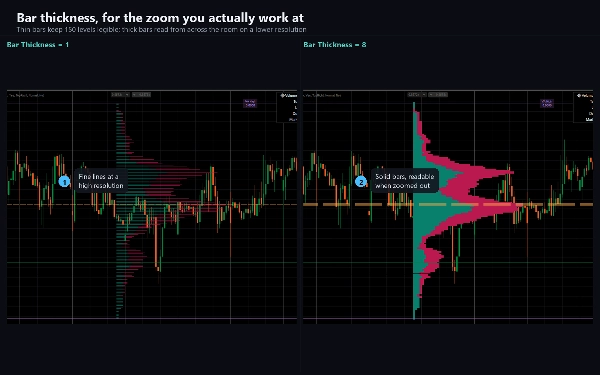
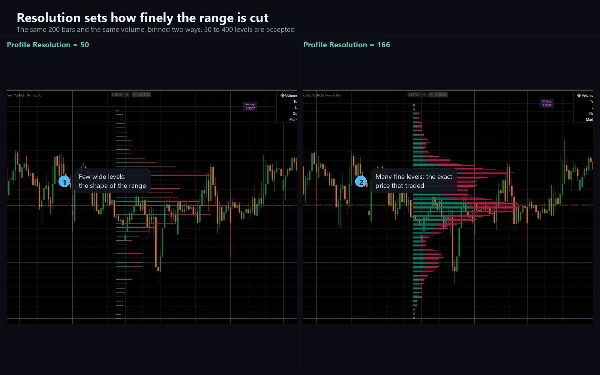
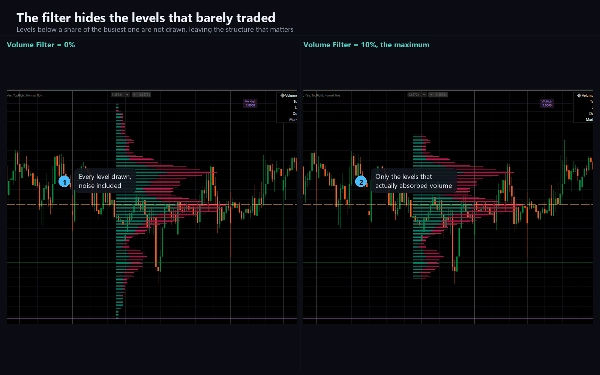
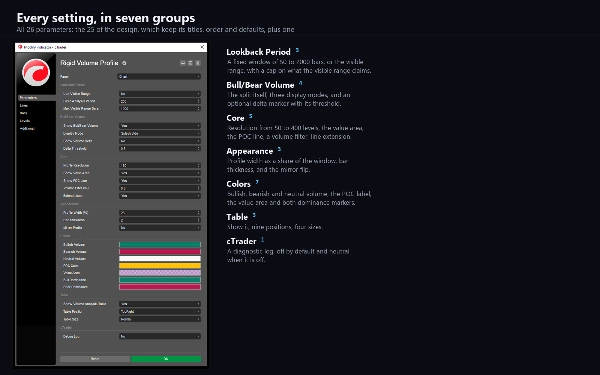
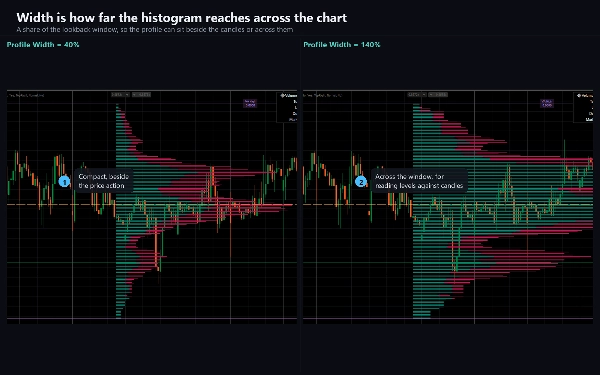
La période d'analyse fixe définit le retour en barres, de 50 à 2000. La résolution du profil définit en combien de niveaux de prix la plage est divisée, de 50 à 400 ; moins de niveaux donnent un profil classique, plus donnent des détails fins. Le mode d'affichage propose Côté à Côté, Empilé et Divisé. La largeur du profil ajuste l'histogramme en pourcentage du retour. Le filtre de volume cache les niveaux en dessous d'un pourcentage du plus occupé. Afficher le delta de volume ajoute un marqueur où un côté domine clairement. Chaque couleur est ajustable, et le tableau d'analyse peut être déplacé à n'importe laquelle des neuf positions ou désactivé.
Utiliser la plage visible change le retour aux barres actuellement à l'écran au lieu d'un compte fixe.
TYPE D'INDICATEUR ET FENÊTRE
Superposition sur le graphique. Il dessine sur le graphique des prix lui-même, pas dans un panneau séparé.
UNITÉS DE TEMPS ET INSTRUMENTS
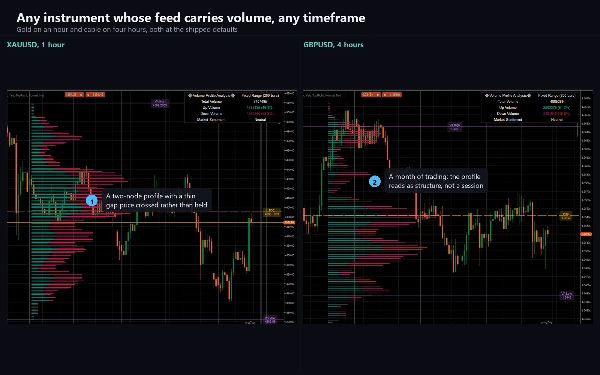
Toute unité de temps. Il est le plus utile en intraday, de M5 à H4, où la distribution du volume d'une session est un objet significatif.
Fonctionne sur tout instrument dont le flux porte le volume. Sur le forex, c'est le volume tick, le nombre de mises à jour de prix par barre, qui est un proxy pour l'activité plutôt que la taille échangée. Sur les CFD d'indices et de matières premières, certains courtiers fournissent le volume réel de la bourse, et le profil y est plus significatif. Sur un instrument sans volume du tout, rien n'est dessiné.
POUR QUI C'EST
Les traders qui travaillent déjà avec des profils de volume et veulent un profil avec une grille fixe ajustable et une division explicite entre achat et vente, plutôt qu'un profil de session fixe.
ESSAI
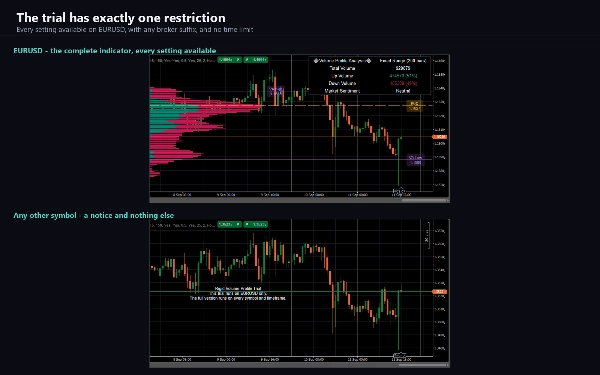
Une version d'essai est jointe à ce produit. C'est l'indicateur complet avec tous les réglages disponibles, limité à EURUSD. La version complète supprime cette restriction et n'ajoute rien d'autre.
NOTES TECHNIQUES ET LIMITATIONS
Le profil est recalculé à chaque tick de la barre en formation, donc le Point de Contrôle et la zone de valeur bougent à l'intérieur d'une barre et se stabilisent à sa clôture. C'est intentionnel. Rien ici n'est un signal de barre clôturée.
Au-dessus d'une résolution de profil de 166, les niveaux de prix les plus bas ne sont pas dessinés. C'est une limite délibérée du design, qui réserve un nombre fixe d'objets de dessin et en utilise trois par niveau de prix ; les bascules Afficher la ligne POC et Afficher la zone de valeur libèrent chacune un objet. Gardez la résolution du profil à 166 ou moins pour voir le profil complet.
La zone de valeur est construite en classant les niveaux par volume et en les prenant dans cet ordre jusqu'à atteindre 70 %, puis en rapportant le prix le plus haut et le plus bas parmi eux. Elle est donc généralement plus large qu'une zone de valeur construite en partant du Point de Contrôle vers l'extérieur.
Parce que le profil est construit à partir du volume de votre courtier, deux courtiers ne produiront pas un profil identique à partir du même marché.
AccessRights est Aucun : l'indicateur ne place aucune ordre, ne modifie rien et ne lit aucune donnée de compte.
SUPPORT
Une documentation couvrant chaque paramètre, les réglages qui surprennent les gens, et un guide de dépannage sont fournis avec le produit. Les questions sont les bienvenues via l'onglet Discussion ; un rapport utile nomme le symbole, le courtier, l'unité de temps, la version de cTrader et les réglages modifiés par rapport aux valeurs par défaut.
Le trading comporte des risques. Les performances passées ne garantissent pas les résultats futurs.
Résumé
Users can customize the lookback period (50 to 2000 bars), profile resolution (50 to 400 levels), display mode (side by side, stacked, split), profile width, and volume filtering. The profile updates dynamically on every tick of the forming bar. It supports any timeframe and instruments with volume data, including tick volume for forex and real exchange volume for some CFDs. The indicator is intended for traders familiar with volume profiles seeking detailed buying and selling pressure insights on a fixed grid rather than session-based profiles. A trial version is available with full features restricted to EURUSD.