


Description
Smart Liquidity Matrix marque la structure laissée par le flux d'ordres institutionnel, et maintient une
lecture continue de la même configuration sur vingt-quatre périodes temporelles simultanément.
CE QU'IL DESSINE
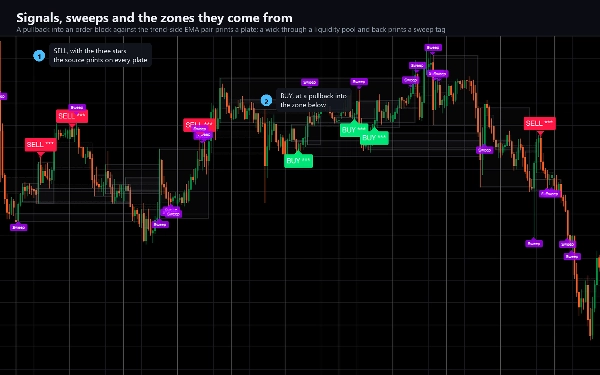
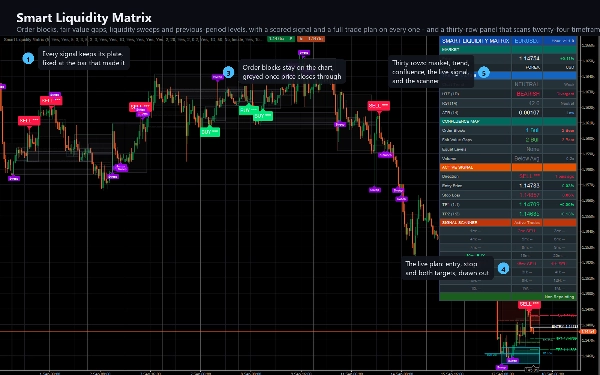
Blocs d'ordres. À chaque retournement confirmé, la dernière bougie opposée avant le mouvement est encadrée. La zone
reste active jusqu'à ce que le prix la franchisse à la clôture, puis devient grisée plutôt que de disparaître, afin que vous puissiez toujours
voir où elle se trouvait.
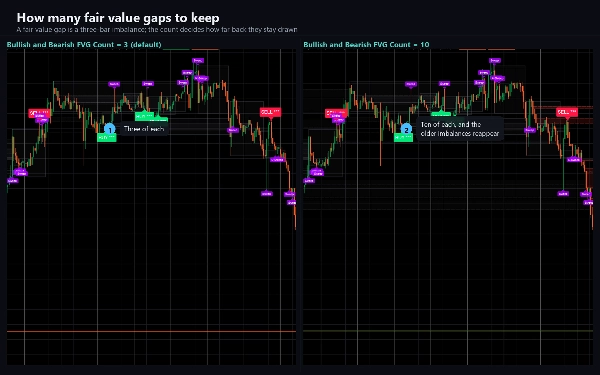
Gaps de valeur équitable. Déséquilibres sur trois barres, dessinés au moment de leur formation et grisées lorsque le prix revient
les traverser à la clôture.
Hauts et bas égaux. Les retournements qui correspondent dans un dixième de l'ATR actuel sont reliés par un niveau pointillé
et étiquetés EQH ou EQL. Ce sont les bassins que les balayages de liquidité recherchent.
Balayages de liquidité. Lorsque le prix perce un niveau égal ou le plus haut ou bas de la période précédente et
reclôture à l'intérieur, la barre est marquée. Chaque balayage peut déclencher une alerte.
Niveaux et équilibre de la période précédente. Le plus haut et le plus bas du jour précédent, dessinés avec leur propre lueur,
plus la ligne à cinquante pour cent entre le plus haut et le plus bas du retournement actuel.
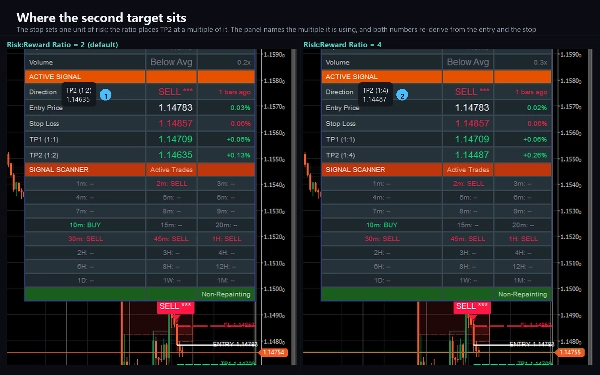
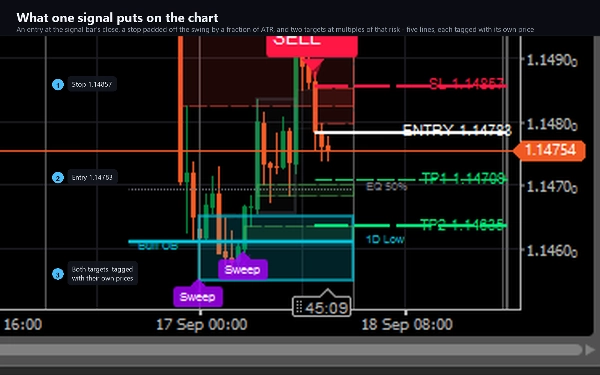
Signaux d'achat et de vente avec une image du risque. Une entrée en repli contre la paire EMA côté tendance, avec
l'entrée, le stop et deux objectifs dessinés à droite de la barre et étiquetés avec leurs prix.
LE SCANNER
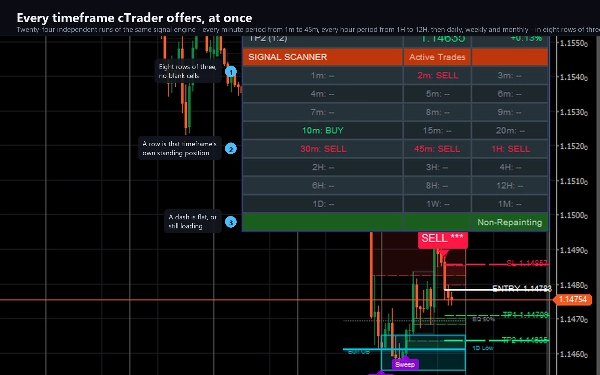
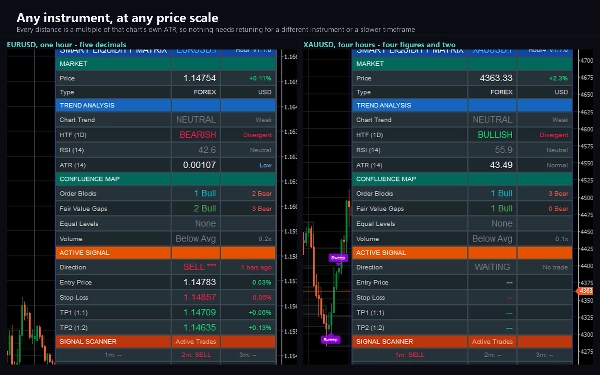
Le tiers inférieur du tableau de bord exécute la même logique de signal sur vingt-quatre périodes temporelles
indépendamment, de une minute à un mois, et affiche si chacune détient actuellement une position longue,
courte, ou rien. L'accord entre les lignes voisines est l'essentiel : une vente affichée sur trente minutes,
quarante-cinq minutes et une heure ensemble se lit très différemment d'un signal isolé sur une seule ligne.
Ces vingt-quatre correspondent à toutes les périodes standards offertes par cTrader : une, deux, trois, quatre, cinq, six,
sept, huit, neuf, dix, quinze, vingt, trente et quarante-cinq minutes, puis une, deux, trois, quatre,
six, huit et douze heures, puis quotidien, hebdomadaire et mensuel. Chacune est lue à partir des mêmes données de barre
que le graphique, donc rien ici ne dépend de l'historique des ticks de votre courtier, et elles remplissent exactement huit lignes de trois
sans cellules vides.
LE TABLEAU DE BORD
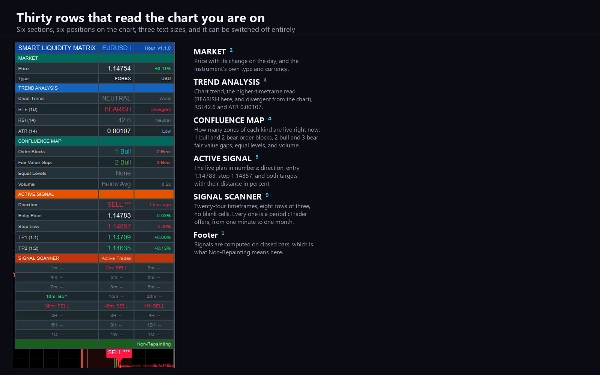
Trente lignes en six sections : marché, analyse de tendance, carte de confluence, signal actif, le
scanner, et un pied de page. Six positions, trois tailles de texte, et il peut être complètement désactivé. La hauteur
des lignes est ajustée pour un panneau de graphique cTrader, qui est généralement plus court qu'un graphique de navigateur.
ALERTES ET AUTOMATISATION
Alertes de journal, sonores et par e-mail sur les signaux, événements de structure et balayages, dédupliquées pour qu'une barre génère
un seul message. Un webhook intégré publie les mêmes événements en JSON à toute adresse de votre choix, via
le service réseau propre à cTrader, afin qu'un bot ou un journal puisse agir sur eux. Il reste désactivé jusqu'à ce que vous saisissiez
une adresse, ne se déclenche jamais pendant le chargement de l'historique de l'indicateur, ne se déclenche jamais en backtest, et est
limité en fréquence.
L'indicateur ne demande aucune permission élevée. Il ne peut pas lire vos fichiers ni lancer un processus.
PARAMÈTRES
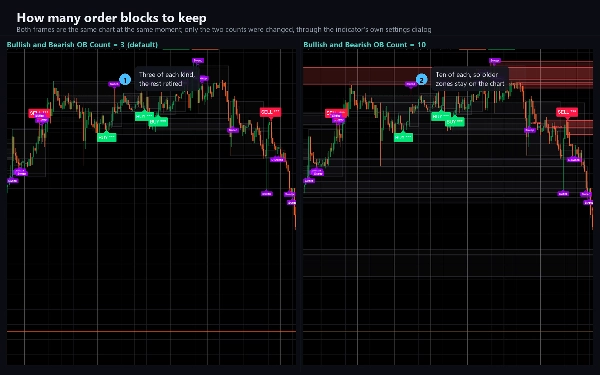
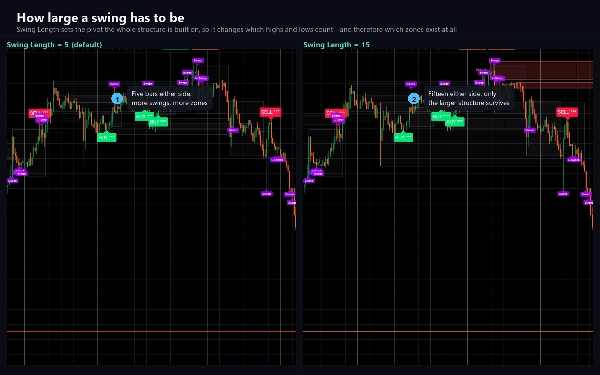
Soixante-dix paramètres en seize groupes. Chaque nombre de zone, couleur, période temporelle et position d'étiquette est
ajustable, et un mode Lite allège chaque ligne pour un graphique plus épuré.
CONVIENT POUR
Forex, indices, métaux et CFD crypto. Toute période temporelle ; les paramètres par défaut ont été définis sur une heure. La
section scanner est la plus informative entre cinq minutes et quatre heures.
CE QU'IL NE FAIT PAS
Il ne place pas, ne modifie pas et ne clôture pas d'ordres. C'est un outil d'analyse et d'alerte. Les signaux sont calculés
uniquement sur des barres clôturées et ne se réaffichent pas.
Le trading comporte des risques. Les performances passées ne garantissent pas les résultats futurs.
Résumé
A unique feature is its 24-timeframe signal scanner, which independently analyzes from one minute to monthly intervals, showing long, short, or neutral signals to identify multi-timeframe agreement. The dashboard organizes information into six sections including market data, trend analysis, confluence, active signals, and the scanner, optimized for cTrader’s chart pane.
Alerts can be configured for signals, structure events, and sweeps, with options for log, sound, email, and webhook notifications for automation or journaling. The indicator uses closed bars only and does not repaint. It offers extensive customization with seventy adjustable parameters and a Lite Mode for cleaner visuals. It does not execute trades but serves as an analytical and alerting tool.
Avis clients
5 | 100 % | |
4 | 0 % | |
3 | 0 % | |
2 | 0 % | |
1 | 0 % |













![Logo de "Smart Money Concepts (SMC) [Iridio Capital]"](https://cdn.ctrader.com/image/webp/b4b5414d-a5ca-44b7-a947-e28eca44a218_61548)



![Logo de "[CB] Pivot Points Pro"](https://cdn.ctrader.com/image/webp/43463c82-67b0-4f10-a4ba-901bba091d81_32594)










