
Descrizione
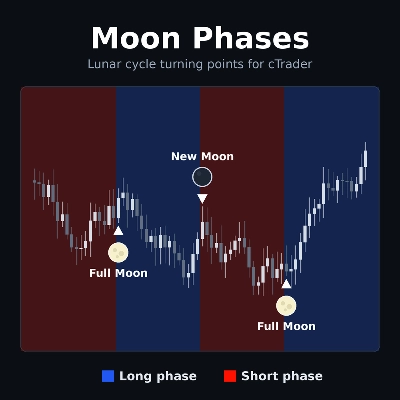
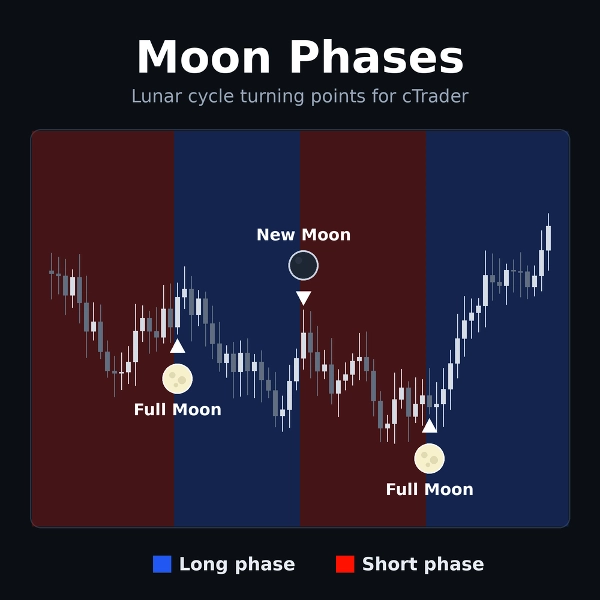
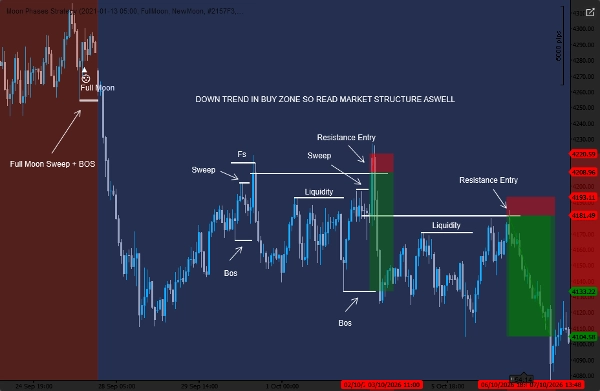
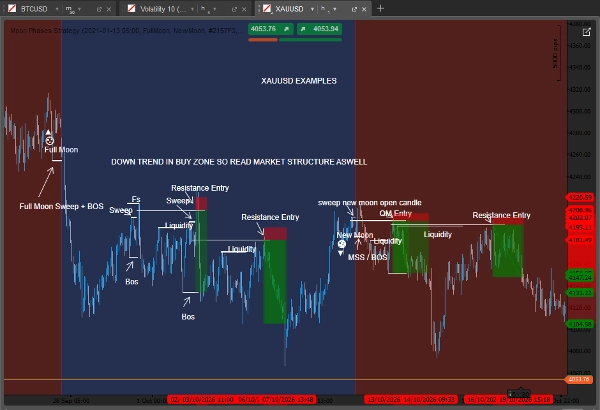
Moon Phases is a time-based cycle indicator for cTrader. It follows the 29.53-day lunar cycle and splits your chart into blue and red phases. Each time the phase flips, it marks the bar with the moon, a label and an arrow.
What it analyses
- It works from the calendar, not from price patterns. Each bar’s date and time is used to work out where it falls in the lunar cycle.
- The phase changes at a new moon or a full moon, depending on your settings.
- Optionally, the Higher Moon and Lower Moon modes compare the close at the last two moon events to decide the phase.
How to read it
- A blue background is the long phase. A red background is the short phase.
- A ▲ arrow with a moon and label below the bar marks a flip to blue.
- A ▼ arrow with a moon and label above the bar marks a flip to red.
- With the default settings, blue starts at the Full Moon and red starts at the New Moon.
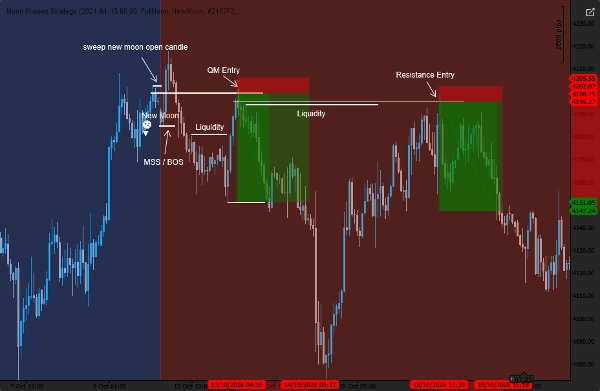
- The moons stay fixed on the bar where the flip happened. They don’t move when you scroll or zoom.
Key settings
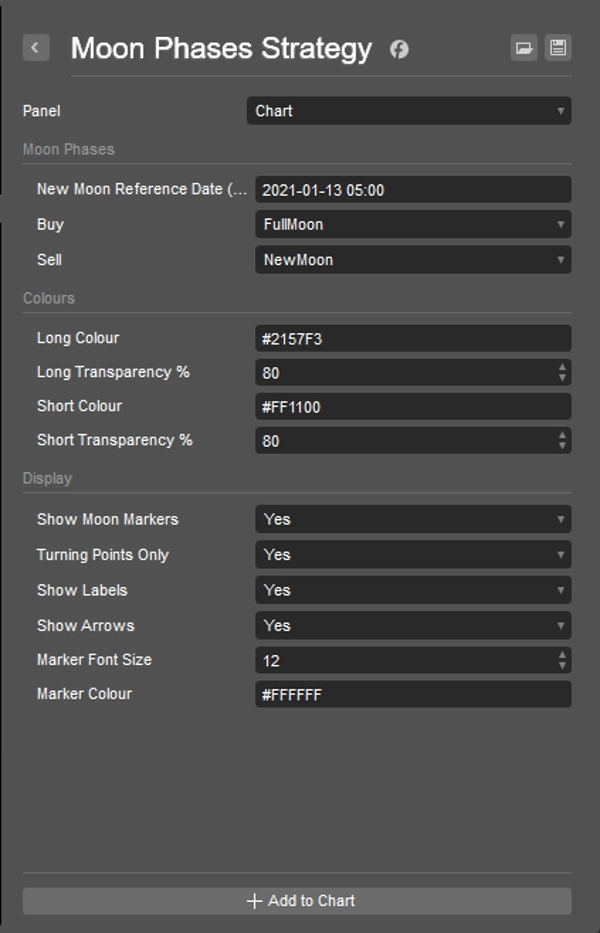
- New Moon Reference Date (UTC): the starting point of the cycle.
- Buy / Sell: choose New Moon, Full Moon, Higher Moon or Lower Moon to decide when the phase flips.
- Long and Short colour and transparency.
- Show Moon Markers, Turning Points Only, Show Labels and Show Arrows.
- Marker font size and marker colour.
Typical use
- Spot cycle turning points on any symbol and timeframe.
- Scroll back through history and see how price behaved around each flip.
- Use the phases as a timing filter alongside your own strategy.
Best suited for
- Traders who like cycle or time-based analysis and want it on the chart.
- Any experience level, since the indicator is simple to read.
Limitations and notes
- It does not place trades or give advice. It only draws on the chart.
- The phases come from the calendar only. They don’t consider price action, news or volatility, so test them on your own symbols before relying on them.
- On the daily timeframe, a moon can land one bar earlier or later depending on when your broker’s day starts.
- In Higher Moon and Lower Moon mode, the marker on the current bar can change until that bar closes.
- It’s a visual tool, and nothing here guarantees results.
Riepilogo
Profilo indicatore
Categoria indicatore
Pattern
Tipo di output
Visualizzazione
Requisiti per i dati
Solo barre
Segnali supportati
Inversione
Discussioni
Recensioni dei clienti
0.0
Recensioni: 0
Recensioni dei clienti
Questo prodotto non ha ancora ricevuto recensioni. L'hai già provato? Fallo sapere agli altri per primo!
Domande frequenti
Supertrend
Liquidity Grab
I prodotti disponibili tramite cTrader Store, inclusi bot di trading, indicatori e plugin, sono forniti da sviluppatori terzi e resi disponibili esclusivamente a scopo informativo e di accesso tecnico. cTrader Store non è un broker e non fornisce consulenze in materia di investimento, raccomandazioni individualizzate o garanzie di risultati futuri.
Altro da questo autore

Prezzo
1
Vendite