
Description
Indicateur de motif Marteau – Explication de la stratégie
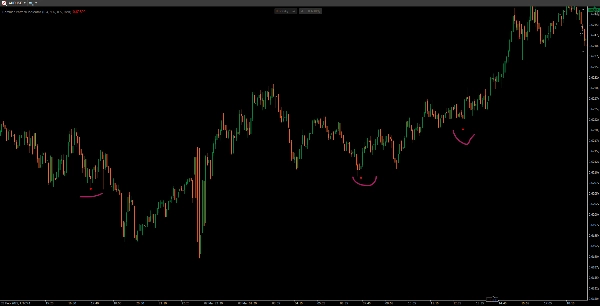
Cet Indicateur de motif Marteau est un signal de retournement basé sur les chandeliers qui identifie les motifs marteau haussiers dans une tendance baissière. Il est conçu pour détecter les retournements de tendance potentiels et mettre en évidence des opportunités d'achat.
Comment ça fonctionne
1️⃣ Détecte la tendance baissière
- Le prix de clôture de la bougie doit être inférieur à la clôture d'il y a 3 barres, indiquant une tendance baissière potentielle.
2️⃣ Valide la structure du chandelier marteau
- Petit corps : Le corps de la bougie est relativement petit (≤ 30 % de la plage totale).
- Longue ombre inférieure : La mèche inférieure est au moins 2 fois la taille du corps (montre un fort rejet des prix plus bas).
- Ombre supérieure courte : La mèche supérieure est ≤ 30 % de la taille du corps (indiquant peu de résistance en haut).
3️⃣ Trace un signal d'achat
- Si toutes les conditions sont remplies, un point rouge (ou une couleur choisie) apparaît légèrement en dessous du plus bas de la bougie marteau comme une confirmation visuelle d'un retournement potentiel.
Caractéristiques clés
✅ Filtre les signaux faibles en assurant une tendance baissière préalable.
✅ Paramètres personnalisables pour la taille du corps, la longueur des ombres et les couleurs.
✅ Motif de chandelier simple mais efficace pour les traders swing et les traders d'action de prix.
📌 Meilleure utilisation : Confirmez le motif marteau avec des indicateurs supplémentaires (par ex., volume, niveaux de support) pour des signaux plus forts ! 🚀
Résumé
Avis clients
5 | 100 % | |
4 | 0 % | |
3 | 0 % | |
2 | 0 % | |
1 | 0 % |


