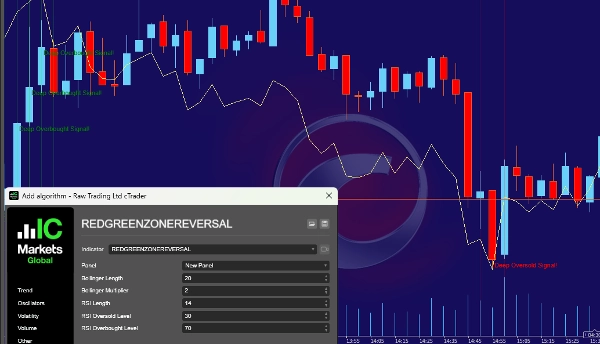
Courtiers & props
Pour entreprise
00
Days
:
00
Hours
:
00
Minutes
:
00
Seconds
Indicateur
RSI
Indices
Commodities
Stocks
Forex
Signal
Bollinger
Scalping
REDGREENZONEREVERSAL
5.0
03/09/2025
176
Desktop
Depuis le 09/01/2025
Ventes
4
Installations gratuites
313
Image mise en ligne de "REDGREENZONEREVERSAL"

📌 Features & Functionality

  1. Bollinger Bands (20-period SMA with a standard deviation of 2)
    • Upper band: Indicates overbought levels.
    • Lower band: Indicates oversold levels.
  2. Relative Strength Index (RSI) (14-period)
    • RSI above 70 → Market is overbought (excessive buying pressure).
    • RSI below 30 → Market is oversold (excessive selling pressure).
  3. Detects reversal zones:
    • Red Zone (Oversold):
      • Closing price is below the lower Bollinger Band.
      • RSI is below 30 (strong selling pressure).
      • Meaning: The market is oversold, a potential buying opportunity.
    • Green Zone (Overbought):
      • Closing price is above the upper Bollinger Band.
      • RSI is above 70 (strong buying pressure).
      • Meaning: The market is overbought, a potential selling opportunity.
  4. Visual chart markers:
    • Red-shaded zone when oversold (potential buying opportunity).
    • Green-shaded zone when overbought (potential selling opportunity).
  5. Alerts & Sound Signals:
    • Text appears on the chart (“Deep Oversold Signal!” or “Deep Overbought Signal!”).
    • Sound notifications play when an overbought/oversold condition is detected.


🎯 How does this indicator help traders?

Provides warning signals for potential market reversals (at extreme price levels).
Helps traders find strong entry and exit points.
Combines Bollinger Bands and RSI for reliable overbought/oversold detection.
Suitable for day trading, swing trading, and scalping on different timeframes.

🚀 Summary:
This indicator helps identify overbought and oversold conditions and alerts when a price reversal is likely. Traders can use this to make smart buy and sell decisions!


🚨 Trading Risk Disclaimer 🚨

Trading financial instruments, including stocks, forex, cryptocurrencies, commodities, and derivatives, involves a high level of risk and is not suitable for all investors. Before engaging in any form of trading, it is essential to understand the risks involved and carefully consider your financial situation, experience, and risk tolerance.

Markets can be highly volatile, and price movements can be sudden and unpredictable due to economic data releases, geopolitical events, market sentiment, or unexpected news. This volatility can result in substantial gains, but also significant losses. Markets may move against your position quickly, stop-losses and risk management strategies do not guarantee loss prevention, and leverage can amplify both gains and losses, potentially exceeding your initial investment.

There are no guarantees that any trading strategy, technical indicator, or method will result in profits. Historical performance does not guarantee future results, and past success does not ensure future gains. Even professional traders experience losses, market conditions change constantly, and predicting future movements with certainty is impossible. Trading should never be based solely on speculation or emotions.

Using leverage or margin trading allows you to control larger positions with a smaller capital investment, but this also significantly increases risk. Leverage can lead to a rapid loss of capital, margin calls may force liquidation of positions at unfavorable prices, and trading on margin can result in losing more money than initially deposited. Additionally, liquidity risks and slippage can occur, meaning there may not be enough buyers or sellers at a given time, and orders may not be executed at expected prices. Market gaps can lead to sudden price jumps, bypassing stop-loss levels entirely.

Trading requires discipline, patience, and emotional control. Fear, greed, and overconfidence often lead to poor trading decisions, increasing the likelihood of losses. Emotional trading can result in impulsive and irrational decisions, while fear of missing out (FOMO) and revenge trading can lead to excessive risk-taking. Developing a clear strategy and sticking to a risk management plan is crucial.

Regulatory and legal risks must also be considered, as different jurisdictions have different regulations regarding trading and investments. Some financial products may not be available in your country, and regulatory changes can impact market conditions. Always ensure compliance with local laws and financial regulations, trade with reputable and regulated brokers or exchanges, and avoid unregulated platforms that may pose significant financial risks.

Technology-related risks should not be overlooked, as trading relies heavily on trading platforms, internet connectivity, and software execution. Delayed execution due to slow internet or server issues can result in unexpected losses, system failures can cause positions to remain open longer than intended, and cybersecurity risks exist when using online trading platforms.

It is important to note that all trading information, indicators, signals, or tools are for educational purposes only and should not be considered as financial advice. Traders should conduct their own research and, if necessary, consult a licensed financial advisor before making investment decisions. No indicator or strategy guarantees consistent profitability, and the responsibility for all trading decisions lies solely with the individual trader.

The most critical rule in trading is to never trade with money you cannot afford to lose. Trading is inherently risky, and losses can exceed initial investments. Only trade with disposable income that you are prepared to lose, never use borrowed money or essential living expenses, and diversify your investments to avoid putting all funds into a single trade or asset.

Trading is a high-risk activity and should not be relied upon as a primary source of income. Many traders lose money, and only a small percentage achieve long-term profitability. Make informed decisions, manage risks, and always trade responsibly. By using any trading platform, tools, or indicators, you acknowledge and accept the risks associated with trading.

Trade responsibly. Stay informed. Protect your capital. 🚀

5.0
Avis : 1
5
100 %
4
0 %
3
0 %
2
0 %
1
0 %
Avis clients
August 18, 2025
Clear reversal zones, customizable, lightweight. Cons: No history tracking, no alerts, no MTF mode.
Plus de cet auteur
dark-cloud
The Dark Cloud Cover indicator detects a bearish reversal pattern, marking key candles and confirming signals based on v
cBot
Grid
Martingale
Forex
+1
GridStormX
Aggressive scalping grid strategy using martingale with rapid order stacking and dynamic recovery.
cBot
RSI
Prop
XAUUSD
+3
GOLD RAIDER ADVANCED v 1.0
📉 Gold Raider - Proprietary Multi-Factor Algorithmic Momentum Strategy
Vous pourriez aussi aimer
Candle Timer & Strength Panel Demo -
Candle Timer & Strength Panel DEMO for cTrader DEMO VERSION – 24 hours free trial! This is a DEMO version of the Candle
Indicateur
RSI
XAUUSD
Breakout
+5
BOS & CHOCH
Market structural patterns , specifically the concepts of Change of Character (ChoCH) 🔄 and Break of Structure (BoS) 💥
Indicateur
NAS100
NZDUSD
Martingale
+26
OHLC PRO by LudwigICT
OHLC PRO – Advanced Session & Market Structure Tool
Indicateur
NAS100
NZDUSD
Martingale
+26
Liquidity Shift Indicator
Want a cBot based on this indicator? Contact us!
VegaXLR - ZigZag Alerts
cTrader ZigZag Alerts: Precision Swing Detection, Alerts, and Fibonacci.
Indicateur
Grid
NAS100
NZDUSD
+17
Institutional Volume Supply Demand
Volume Profile Supply Demand
MeetAlgo_ChannelTrading_cTrader
Channel Trading is a volatility-based indicator using envelope theory to spot price breakouts and trade signals.
Indicateur
VWAP
ZigZag
Weis & Wyckoff System v2.0
Indicateur
Indices
Forex
EURUSD
+2
US Dollar Index
US Dollar Index
Indicateur
Indices
Prop
Stocks
+5
New Way Sar - Free
The Parabolic SAR, or "Stop and Reverse," is a dynamic technical analysis tool
Vice TrendTrading
Unlike most indicators that show signals blindly, this show valid entries inside TREND ZONES and visual trend BACKTESTS.
Indicateur
NAS100
NZDUSD
Breakout
+12
ATR Bands
Enhance trading with ATR Bands! Visualize market volatility using dynamic upper and lower ATR bands for precise decision
Flex VWAP
Flexible VWAP indicator with timezone-aware, custom time periods and automatic DST handling.
Indicateur
NAS100
NZDUSD
XAUUSD
+7
Bayesian Price Projection Model
Bayesian theory** to forecast a future price while providing **uncertainty ranges** that represent upper and lower bound
Indicateur
NAS100
NZDUSD
XAUUSD
+13
MACD Histogram PRO
Enhance MACD Histogram! Visualize bull and bear price changes with vibrant colors for clearer, more insightful trading.
Sharpe Ratio
Sharp Rate Indikator
Indicateur
NAS100
NZDUSD
XAUUSD
+14
ANCHORED DELTA CANDLE VOLUME PROFILE
Indicateur
Indices
XAUUSD
Stocks
+5
cAlgoBuddy - Ultimate Candlestick Patterns
The ultimate candlestick suite is here to help you detect most of the candlestick patters that exist today.