Deskripsi
Pendahuluan
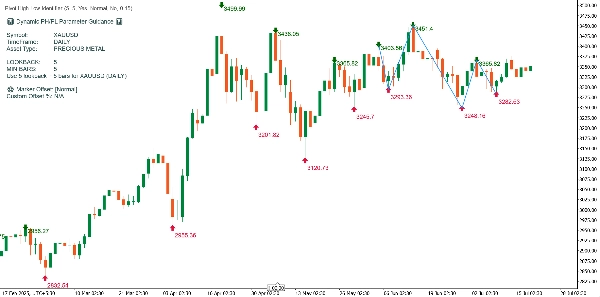
Grafik yang ditampilkan menggunakan indikator cTrader khusus "Visualisasi PH/PL yang Ditingkatkan". Alat ini secara dinamis mengidentifikasi titik ayunan tinggi dan rendah penting (PH/PL), menggambar garis tren zigzag di antaranya, dan menghasilkan panel panduan informatif berdasarkan simbol, kerangka waktu, dan jenis aset yang terdeteksi. Berikut adalah rincian bagaimana indikator memproses dan memberi anotasi pada grafik contoh.
Elemen Kunci yang Ditampilkan pada Grafik
1. Pivot Highs (PH) dan Pivot Lows (PL)
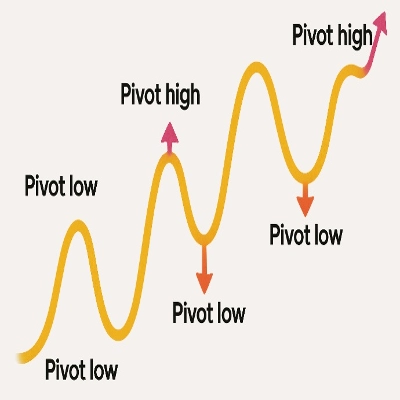
- Pivot Highs: Ditandai dengan panah hijau ke bawah dan harga tertinggi masing-masing di atas batang.
- Pivot Lows: Ditandai dengan panah merah ke atas dan harga terendah masing-masing di bawah batang.
- Logika yang Digunakan: PH terjadi ketika harga tertinggi sebuah batang lebih tinggi dari harga tertinggi 'lookback' batang sebelum dan sesudahnya; PL didefinisikan serupa untuk harga terendah.
- Konfigurasi Lookback: Dalam kode dan grafik Anda, digunakan lookback 5, menghasilkan deteksi ayunan yang kuat dan cocok untuk data harian.
2. Label Harga
- Tampilan yang Dapat Diaktifkan: Label harga yang terpasang pada setiap penanda PH/PL dapat ditampilkan atau disembunyikan melalui parameter indikator. Dalam contoh ini, harga ditampilkan untuk kejelasan.
- Penyesuaian Otomatis Offset: Posisi label secara algoritmik di-offset menggunakan jarak optimal (preset atau kustom), memastikan teks tidak tumpang tindih dengan lilin atau elemen grafik.
3. Garis Tren Zigzag Dinamis
- Visualisasi: Garis zigzag biru menghubungkan titik PH/PL terbaru dan signifikan, menyoroti urutan ayunan harga utama.
- Tujuan: Ini membantu trader melacak secara visual perubahan tren dan pergeseran momentum selama periode grafik.
4. Panel Panduan Dinamis
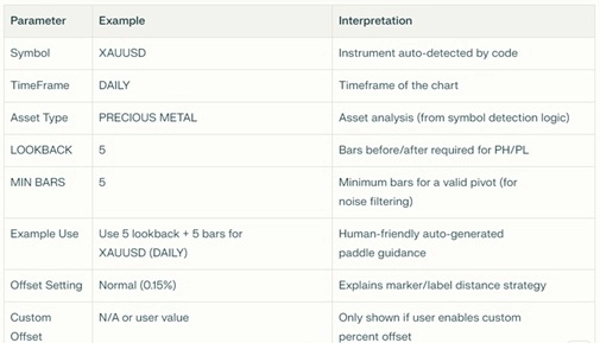
Panel grafik kiri atas merangkum pengaturan utama, hasil deteksi, dan rekomendasi penggunaan
Cara Kerja Indikator pada Grafik Ini
Penjelasan Bertahap:
- Identifikasi Ayunan:
Indikator memindai setiap batang harian setelah inisialisasi, membandingkan harga tertinggi dan terendah selama jendela lima batang di setiap sisi untuk menentukan PH dan PL. - Penempatan Penanda:
PH dan PL ditandai menggunakan panah berwarna; label harga yang sesuai ditempatkan pada jarak optimal untuk memastikan kejelasan. - Visualisasi Tren:
Algoritma memilih 10 pivot terbaru (PH/PL, dapat dikonfigurasi) dan menggambar garis biru yang menghubungkannya, memetakan ayunan pasar utama dan membantu pengenalan tren. - Panel Parameter:
Panel tampilan mengonfirmasi deteksi otomatis jenis aset (di sini: XAUUSD, "LOGAM MULIA") dan memberikan nilai rekomendasi optimal untuk lookback, min bars, dan offset untuk kombinasi ini—semuanya terlihat secara singkat. - Adaptasi Aset Cerdas:
Jika Anda menerapkan indikator ini ke simbol lain (seperti forex eksotik, kripto, atau indeks saham), panel panduan dan logika deteksi menyesuaikan secara otomatis, menetapkan lookback dan min bars yang direkomendasikan untuk perilaku pasar dan kerangka waktu spesifik tersebut. - Pengalaman Grafik Bersih:
Semua objek grafis yang digambar (panah, garis tren, label harga, teks statis) dibersihkan dan digambar ulang setiap perhitungan untuk menghindari kekacauan. Indikator selalu menampilkan informasinya di atas grafik harga, tidak pernah di panel terpisah.
Pelajaran Praktis untuk Trading
- Pengakuan Struktur Ayunan: Anda dapat dengan cepat membaca urutan dan besarnya ayunan pasar.
- Perencanaan Masuk/Keluar: Putaran PH/PL dapat digunakan untuk logika trailing stop atau mengantisipasi titik pembalikan potensial.
- Penggunaan Universal: Tidak peduli aset atau kerangka waktu, indikator menyesuaikan sendiri dan menjelaskan rekomendasinya.
- Visual Profesional yang Jelas: Kekacauan harga dan tumpang tindih label diminimalkan berkat offset cerdas.
Ringkasan
Grafik ini menunjukkan kekuatan dan kejelasan Visualisasi PH/PL yang Ditingkatkan. Indikator memberikan petunjuk visual langsung kepada trader pada titik pivot utama, arah dan ukuran ayunan, serta panduan kontekstual spesifik untuk instrumen dan kerangka waktu. Semuanya otomatis, terkini, dan dapat disesuaikan untuk aset atau lingkungan pasar mana pun.
Catatan: Karena keterbatasan di cTrader, indikator menunjukkan opsi untuk menempatkan indikator pada panel baru tetapi itu tidak berlaku karena indikator tidak dapat dilihat di panel baru karena ukuran dan fungsinya. Juga, jika harga dicetak terlalu jauh dari panah pivot dan membingungkan pengguna maka pengguna dapat memilih secara manual untuk menampilkan harga atau tidak.
Jika Anda membutuhkan kustomisasi lebih lanjut, seperti sinyal suara/peringatan pada pivot, atau penyaringan dinamis untuk ayunan yang lebih kecil, silakan tanyakan!