
Deskripsi
Hyper Trend PRO tidak hanya memberi tahu Anda bahwa tren telah berbalik. Ini memberi tahu Anda seberapa banyak sisa grafik setuju.
Bagaimana sinyal dibuat
SuperTrend yang dibangun berdasarkan average true range menandai tren. Band ditempatkan di atas dan di bawah harga pada kelipatan ATR 25 bar, setiap band hanya bergerak ke satu arah, dan tren berbalik ketika harga menutup melewati band di sisi jauh. Setiap sinyal dimulai sebagai salah satu dari pembalikan tersebut dan tidak ada yang lain yang membuatnya.
Pembalikan kemudian dinilai dari lima. Lima faktor independen memberikan suara:
- histogram MACD, naik atau turun dibandingkan bar sebelumnya
- EMA periode 150 terhadap EMA periode 250
- ADX di atas 20, jadi pembalikan di dalam rentang mati ditandai sebagai satu
- volume dibandingkan rata-rata 20 barnya sendiri
- kemiringan rata-rata bergerak Hull periode 55
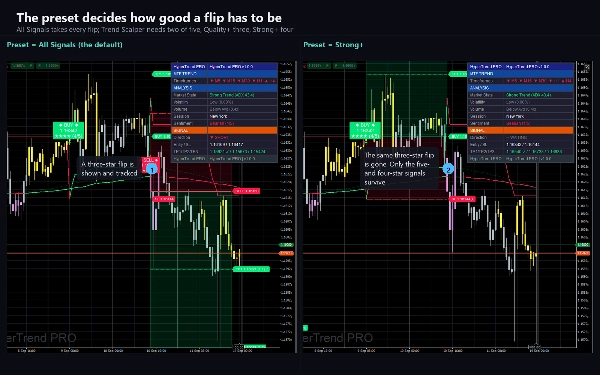
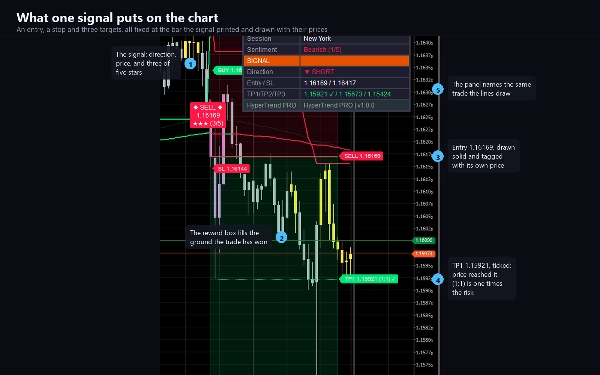
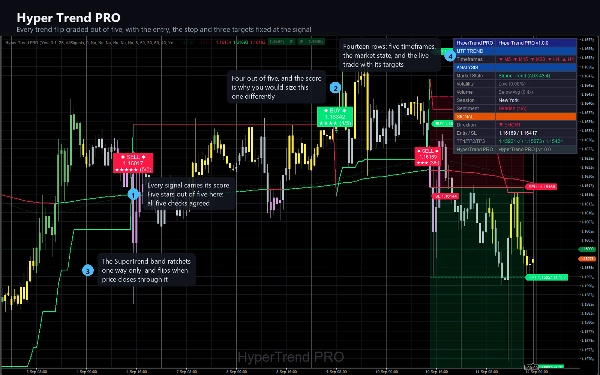
Skor digambar pada sinyal sebagai bintang dan sebagai angka dari lima, dan dinamai pada peringatan sebagai Lemah, Sedang atau Kuat. Ini adalah perbedaan antara pembalikan yang disetujui oleh empat ukuran lain dan yang berdiri sendiri.
Memilih seberapa selektifnya
Preset menetapkan skor minimum yang harus diperoleh pembalikan: Semua Sinyal mengambil semuanya, Trend Scalper membutuhkan dua, Quality+ membutuhkan tiga dan Strong+ membutuhkan empat. Enam filter tambahan masing-masing dapat memveto sinyal sendiri: hanya pasar yang sedang tren, hanya skor kuat, hanya volume di atas rata-rata, hanya yang selaras dengan awan, dan mode kontrarian yang hanya mengambil pembalikan ketika RSI yang dihaluskan sudah meregang ke arah lain. Semua itu mati sampai Anda mengaktifkannya.
Perdagangan yang digambarnya
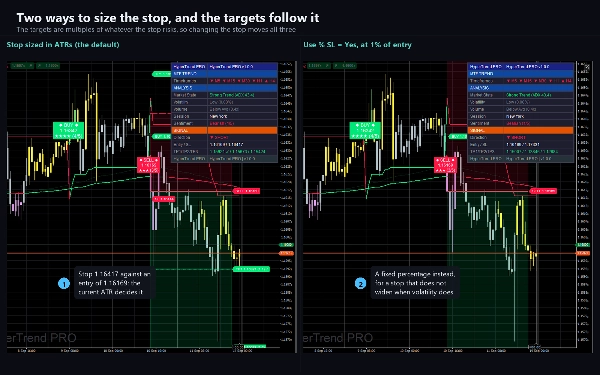
Saat sinyal muncul, indikator menetapkan entri, stop, dan tiga target serta menggambar masing-masing sebagai garis berlabel yang membawa harganya.
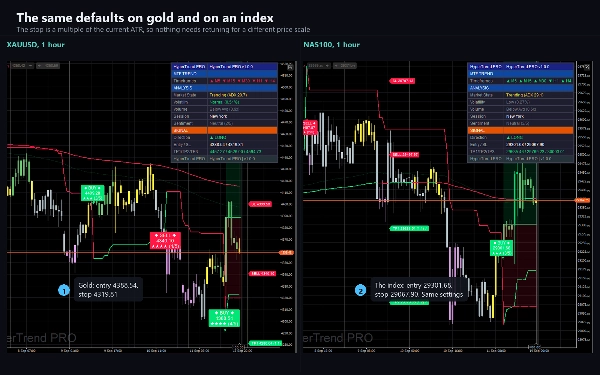
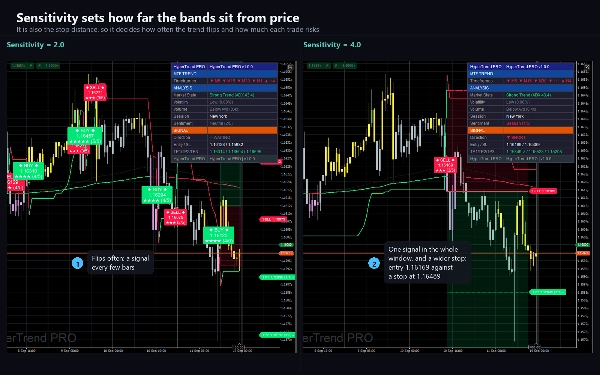
- Stop adalah kelipatan ATR saat ini, sehingga pengaturan yang sama berperilaku masuk akal pada grafik lima menit dan harian, serta pada pasangan mata uang dan emas. Stop persentase tetap juga tersedia sebagai gantinya.
- Tiga target adalah kelipatan risiko yang sama, sehingga default 1.0, 2.0 dan 3.0 secara harfiah adalah satu, dua dan tiga kali risiko Anda.
- Setiap target dicentang saat harga mencapainya. Mencapai target ketiga, atau stop, menutup perdagangan yang dilacak.
- Stop trailing ATR opsional digambar di belakang perdagangan yang terbuka.
Apa lagi yang ada di grafik
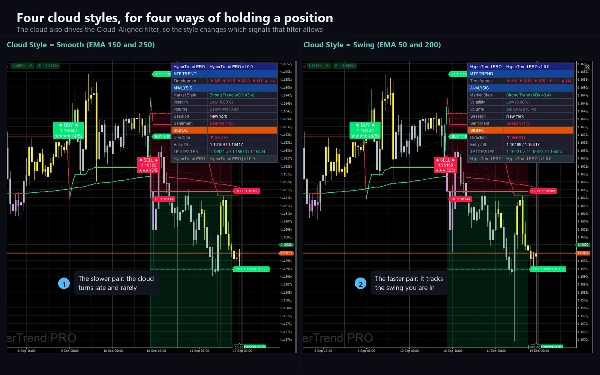
- Awan antara dua rata-rata bergerak, dalam empat gaya: pasangan EMA halus, dua varian scalping dan pasangan swing.
- Garis Trend Tracer periode 250 yang berubah warna sesuai harga.
- Lilin yang diwarnai melalui enam langkah sesuai seberapa kuat histogram MACD relatif terhadap volatilitas, sehingga pergerakan yang melemah terlihat sebelum berbalik. Pengaturan Pewarnaan Lilin mengubahnya ke warna tren, memberi bayangan berdasarkan skor konfluensi, atau membiarkannya sendiri saat indikator lain mewarnai lilin di grafik yang sama.
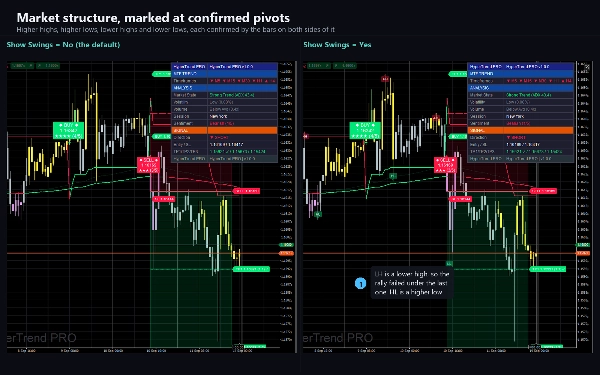
- Label struktur pasar opsional yang menandai higher highs, lower highs, higher lows dan lower lows.
- Penanda pullback opsional dari osilator WaveTrend, untuk masuk kembali di dalam tren daripada di awalnya.
Dashboard
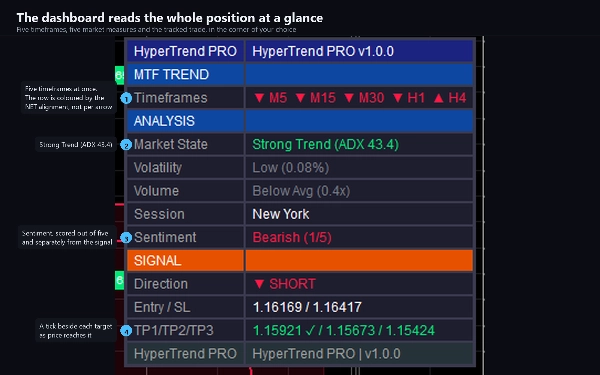
Empat belas baris di sudut pilihan Anda. Blok atas membaca lima kerangka waktu sekaligus, M5 sampai H4, dan menunjukkan arah kemiringan masing-masing. Di bawahnya: keadaan pasar dengan ADX-nya, volatilitas sebagai persentase harga, volume dibandingkan rata-ratanya, sesi perdagangan, dan skor lima poin kedua untuk sentimen keseluruhan. Blok bawah adalah sinyal terakhir, entri dan stop-nya, serta tiga targetnya dengan tanda centang di samping masing-masing yang telah tercapai.
Peringatan
Sembilan peristiwa, masing-masing dengan saklar sendiri: beli, jual, sinyal apa saja, sinyal kuat, stop, tiga target dan perubahan tren. Masing-masing menyala sekali per bar yang tertutup dan tidak pernah untuk sejarah, jadi memasangnya pada grafik panjang tidak menghasilkan tumpukan peringatan lama. Pengiriman melalui log cTrader, suara opsional dan email opsional melalui pengaturan cTrader Anda sendiri.
Pengaturan
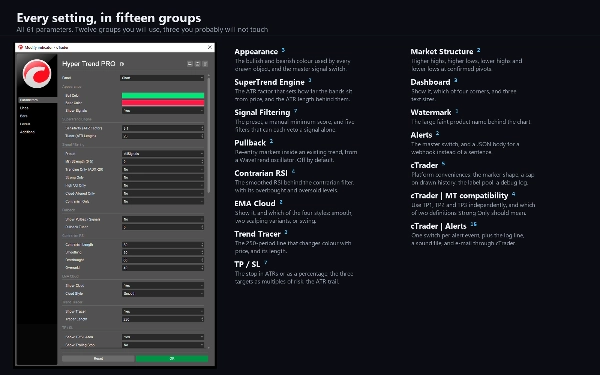
62 parameter dalam dua belas grup yang akan Anda gunakan dan tiga yang mungkin tidak akan Anda sentuh. Tampilan, mesin SuperTrend, penyaringan sinyal, pullback, RSI kontrarian, awan, tracer, risiko, struktur pasar, dashboard, watermark dan peringatan. Sisanya adalah kenyamanan cTrader: mode pewarnaan lilin, gaya penanda, batas objek, log debug, tiga saklar kompatibilitas dan satu saklar per peristiwa peringatan.
Tipe, kerangka waktu dan instrumen
Indikator overlay untuk analisis tren dan momentum. Rata-rata terpanjangnya adalah 250 bar, jadi membutuhkan grafik dengan beberapa riwayat; M15, H1 dan H4 adalah jendela yang dirancang, dan berjalan pada kerangka waktu apa pun. Telah diuji pada pasangan mata uang utama, emas dan indeks. Menggunakan bar dan volume: tidak ada data tick, tidak ada kedalaman pasar, tidak ada data eksternal.
Untuk siapa ini
Trader yang menginginkan sinyal tren yang disertai nilai bukan hanya ya atau tidak, dan yang menginginkan stop dan target ditentukan pada saat yang sama dengan entri, bukan setelahnya.
Versi percobaan
Edisi percobaan adalah build yang sama dengan satu batasan: hanya berjalan pada EURUSD, dan sufiks broker seperti EURUSD.i diterima. Tidak ada batas waktu dan semua parameter tersedia. Versi lengkap menambahkan semua simbol lainnya.
Catatan teknis
Sinyal tidak diwarnai ulang. Mereka dievaluasi hanya pada bar yang tertutup, jadi penanda tidak pernah muncul selama lilin dan kemudian hilang saat lilin menutup. Biayanya adalah keterlambatan satu bar, dan itu disengaja. Saat perdagangan terbuka, garis level dan labelnya meluas ke kanan bersama grafik, yang memindahkan gambar bukan levelnya.
Indikator tidak menyatakan hak akses. Tidak membuka koneksi jaringan, tidak membaca file, dan tidak pernah menempatkan, memodifikasi atau menutup order. Tanda centang di dashboard mencatat bahwa harga menyentuh level yang digambar pada riwayat yang dimuat, tanpa spread, komisi atau slippage di dalamnya.
Dukungan
Pertanyaan diajukan melalui tab Diskusi pada listing ini. Harap sertakan simbol, kerangka waktu, broker, versi cTrader dan tangkapan layar dengan dashboard terlihat.
Perdagangan melibatkan risiko. Kinerja masa lalu tidak menjamin hasil di masa depan.
Ringkasan
The indicator fixes entry points, ATR-based stops, and three risk-multiplied targets at the moment a signal occurs, with optional trailing stops. Multiple filters allow users to customize signal selectivity, including trend strength, volume, cloud alignment, and contrarian RSI conditions.
Additional chart features include a configurable cloud between moving averages, a 250-period Trend Tracer line, candle tinting based on MACD strength, market structure labels, and pullback markers from a WaveTrend oscillator. A dashboard displays multi-timeframe trend direction, market state, volatility, volume, session info, sentiment scores, and trade progress.
Hyper Trend PRO supports major currency pairs, gold, and indices, using bar and volume data without tick or external inputs. Alerts cover nine event types with controlled delivery. The indicator does not repaint and operates with a one-bar delay for signal confirmation. It requires no special access rights or order execution capabilities.