
Deskripsi
- Apa yang dilakukannya (nilainya).
- Bagaimana ini membantu trader.
- Apa yang membuatnya unik.
- Cara menggunakannya (singkat).
- Apa yang akan dibuka versi berbayar (teaser).
🔸
Indikator Jam Emas Sesi
(Versi Gratis)
Deskripsi
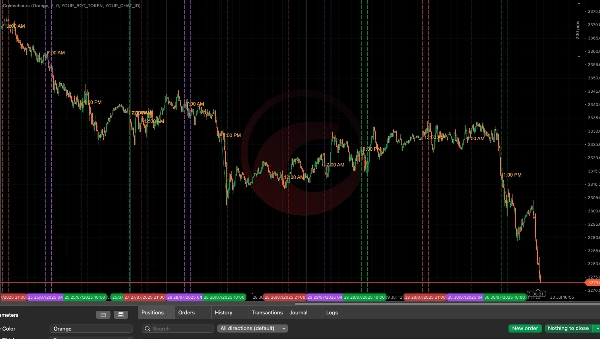
Indikator Jam Emas Sesi dirancang untuk trader serius yang ingin memvisualisasikan jendela trading dengan probabilitas tinggi berdasarkan pola likuiditas berbasis sesi. Alat ini secara otomatis menyoroti periode waktu utama di sesi Asia, London, dan New York — yang sering disebut sebagai “jam emas” pasar — ketika harga paling mungkin keluar dari rentang dan mengungkapkan niat institusional.
Apa yang Dilakukan:
- Melacak harga tertinggi/terendah sesi Asia (00:00–08:00 UTC) untuk memetakan zona likuiditas.
- Menyoroti jam-jam kunci London dan New York seperti:
-
- Pra-Tutup London (06:00–07:00 UTC)
- Jam Tutup London (07:00–08:00 UTC)
- Zona Sapu Sore NY (13:00–14:00 UTC)
- Menggambar panduan visual di grafik Anda untuk mengarahkan kesadaran Anda pada jam breakout harian.
Bagaimana Ini Membantu Anda:
- Mudah mengenali zona sapu likuiditas selama tumpang tindih sesi.
- Fokuskan keputusan trading Anda pada kerangka waktu smart money — tidak lagi trading di zona mati.
- Mengenali secara visual di mana fake-out dan pembalikan cenderung terjadi.
- Bekerja di instrumen apa pun dan kerangka waktu apa pun yang mengikuti siklus sesi global.
Fitur Utama:
- Warna garis, ketebalan, dan ekstensi waktu yang dapat disesuaikan.
- Pelacakan sesi otomatis tanpa perlu plotting manual.
- Dukungan bawaan untuk 15 hari trading terakhir.
- Visual grafik yang bersih dan tidak mengganggu.
Cocok Untuk:
- Trader gaya ICT (model likuiditas + waktu)
- Scalper price action
- Trader yang menggunakan konfluensi berbasis waktu
🔓 Ingin Lebih?
Versi Pro (Segera Hadir) menambahkan:
- Peringatan breakout waktu nyata yang dikirim langsung ke Telegram
- Logika untuk fake-out Asia → pembalikan London dan harga tertinggi/terendah London → pembalikan NY
- Timer cooldown pintar untuk menghindari peringatan berlebihan
- Pelacakan penuh harga tertinggi/terendah berbasis sesi dengan pelabelan sinyal
- Roadmap masa depan: peringatan FVG, zona likuiditas internal, dan penyaringan sinyal
Ringkasan
Profil indikator
Ulasan pelanggan
4.0
Ulasan: 1
5 | 0 % | |
4 | 100 % | |
3 | 0 % | |
2 | 0 % | |
1 | 0 % |
Diskusi
Pertanyaan umum
Produk-produk yang tersedia melalui cTrader Store, termasuk bot trading, indikator, dan plugin, disediakan oleh pengembang pihak ketiga serta hanya ditujukan untuk akses teknis dan informasi. cTrader Store bukan broker dan tidak menyediakan saran investasi, rekomendasi pribadi, atau jaminan apa pun tentang kinerja di masa mendatang.


Harga
3
Instal gratis