
Scalper Signal MTF
Indicateur
253 téléchargements
Version 1.0, Aug 2025
Windows, Mac
Description
Aperçu
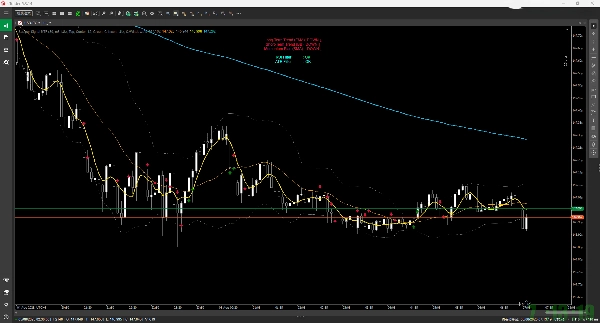
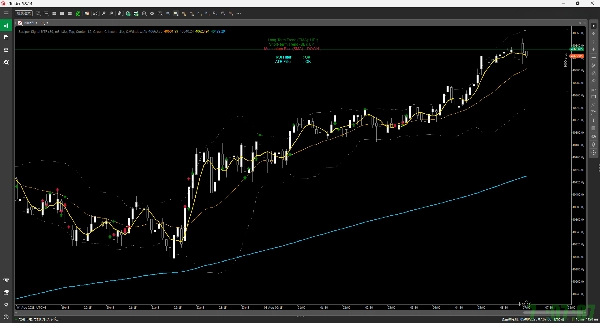
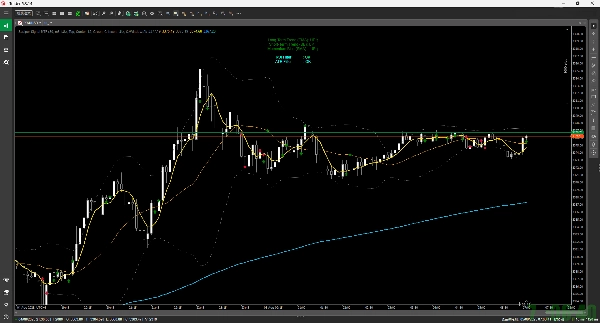
Basé sur des indicateurs techniques d'une période spécifiée (par exemple, 5 minutes), il affiche des signaux d'achat/vente (flèches) sur le graphique actuel. Il simule également des transactions après l'apparition d'un signal et trace une marque (une étoile) au point de sortie potentiel.
Fonctionnalités principales
- Affichage des signaux d'achat/vente :
-
- Signal d'achat (flèche vers le haut) : Basé sur un croisement doré de la SMA (moyenne mobile simple), combiné avec des conditions du RSI, de la EMA 200 et des bandes de Bollinger pour identifier des opportunités d'achat favorables.
- Signal de vente (flèche vers le bas) : Basé sur un croisement mort de la SMA, combiné avec des conditions du RSI, de la EMA 200 et des bandes de Bollinger pour identifier des opportunités de vente favorables.
- Simulation de transaction :
-
- Après un signal, il suppose qu'une transaction est clôturée si l'une des conditions suivantes est remplie, et marque le graphique avec une icône étoile :
-
- Prise de profit / Stop loss (basé sur l'ATR et un ratio Risque:Récompense spécifié).
- Contact avec les bandes de Bollinger (bandes supérieure/inférieure ou ligne médiane).
- Dépassement du temps de détention maximal.
- Les stops à l'équilibre et suiveurs sont également calculés en interne.
- Affichage du tableau de bord :
-
- Affiche un résumé simple de l'environnement actuel du marché en haut à gauche du graphique, incluant la tendance à long terme (EMA), la tendance à court terme (BB) et le momentum (SMA).
- Fonction d'alerte :
-
- Fournit une notification sonore lorsqu'un nouveau signal est généré.
Paramètres
Vous pouvez personnaliser librement les éléments suivants dans les paramètres de l'indicateur :
- La période utilisée pour les calculs (MTF).
- Les périodes pour les différents indicateurs (SMA, RSI, BB, EMA).
- Les règles de sortie de transaction (par exemple, ratio Risque:Récompense, temps de détention maximal).
- Paramètres d'affichage pour les signaux et le tableau de bord (visibilité, couleurs, taille).
Résumé
Résumé IA
Scalper Signal MTF is a custom indicator designed for the cTrader platform that provides multi-timeframe scalping signals. It analyzes technical indicators from a chosen timeframe—such as 5 minutes—and displays buy (up arrow) and sell (down arrow) signals on the current chart. Buy signals are generated based on an SMA golden cross combined with RSI, 200 EMA, and Bollinger Bands conditions; sell signals use an SMA dead cross with similar criteria.
The indicator simulates trades after signals appear and marks potential exit points with a star icon. Trade exits are triggered by take profit or stop loss levels (calculated using ATR and a specified risk-reward ratio), touching Bollinger Bands, exceeding maximum holding time, or internal breakeven and trailing stop calculations.
A dashboard on the chart’s top-left summarizes the current market environment, showing long-term trend (EMA), short-term trend (Bollinger Bands), and momentum (SMA). The indicator also provides sound alerts when new signals occur.
Users can customize the timeframe for calculations, indicator periods (SMA, RSI, BB, EMA), trade exit rules, and display settings including signal and dashboard visibility, colors, and sizes.
Profil de l'indicateur
Avis clients
0.0
Avis : 0
Avis clients
Il n'y a pas encore d'avis sur ce produit. Vous l'avez déjà essayé ? Soyez le premier à en parler aux autres !
Discussion
Questions fréquentes
Les produits disponibles sur cTrader Store, notamment les bots de trading, les indicateurs et les plug-ins, sont fournis par des développeurs tiers et mis à disposition à titre informatif et à des fins d'accès technique uniquement. cTrader Store n'est pas un courtier et ne fournit aucun conseil en investissement, aucune recommandation personnelle ni aucune garantie quant aux performances futures.
Plus de cet auteur


Prix
1
Ventes
1.34K
Installations gratuites