
Deskripsi
📈 Stochastic RSI
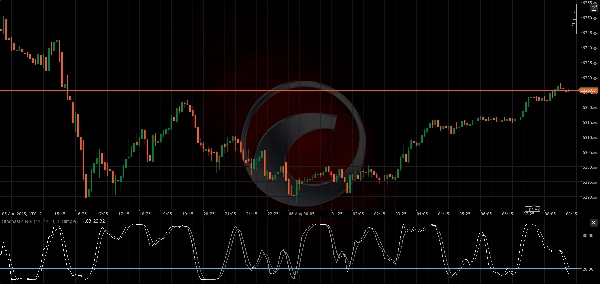
Indikator Stochastic RSI adalah osilator momentum yang menerapkan rumus Stochastic pada nilai RSI daripada harga, menjadikannya indikator turunan kedua. Ini sangat berguna untuk mengidentifikasi kondisi jenuh beli dan jenuh jual dengan sensitivitas lebih tinggi daripada RSI standar.
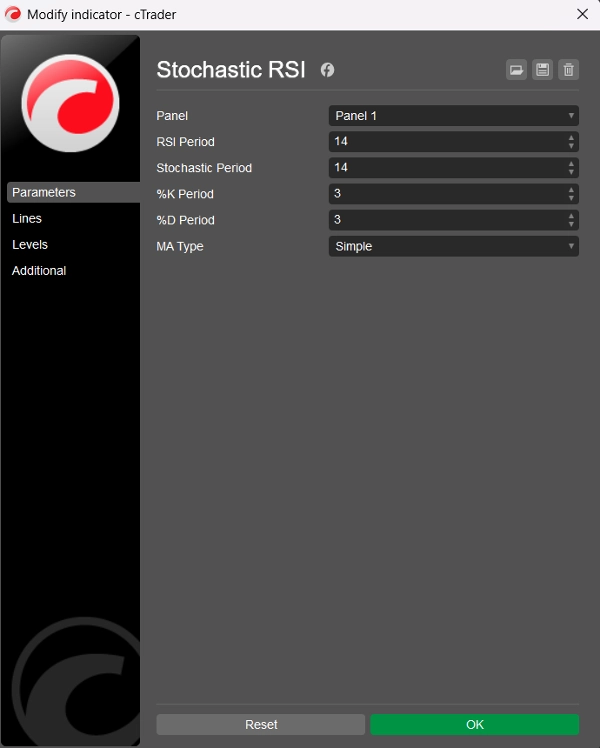
🛠️ Parameter
Periode RSI: Periode lookback yang digunakan untuk menghitung RSI dasar (default = 14)
Periode Stochastic: Periode lookback yang diterapkan pada nilai RSI untuk menghitung Stochastic RSI (default = 14)
Periode %K: Periode perataan untuk garis %K (default = 3)
Periode %D: Periode perataan untuk garis %D (default = 3)
Tipe MA: Tipe moving average untuk perataan: Pilihan dari 11 tipe (default = Simple)
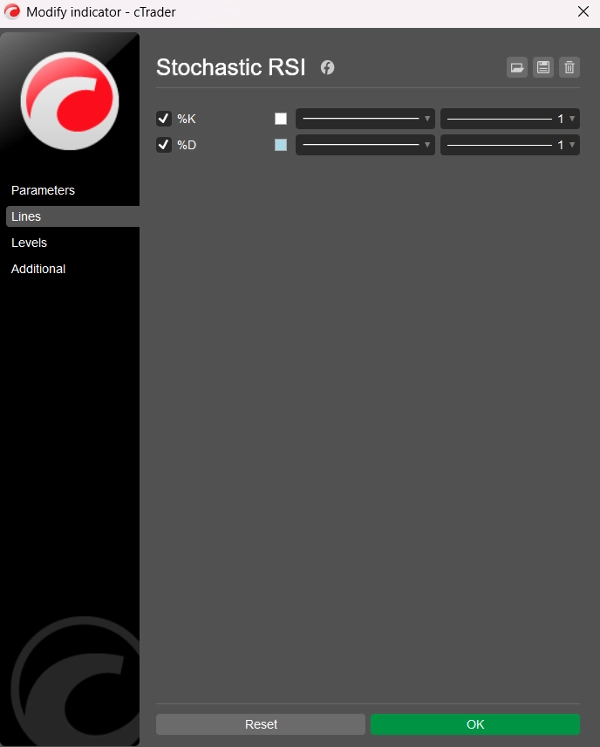
📊 Garis Output
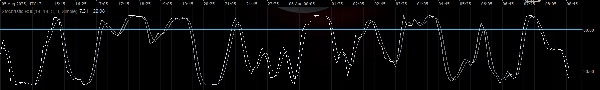
- Garis %K: Stochastic RSI yang telah diratakan (putih)
- Garis %D: Moving average yang diratakan dari %K (biru muda)
Kedua garis berosilasi antara 0 dan 100, memungkinkan pembacaan jenuh beli dan jenuh jual yang jelas.
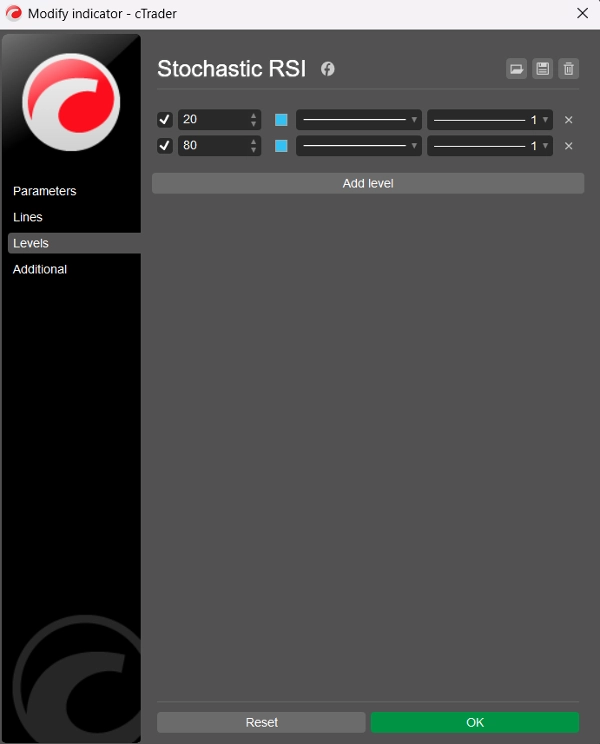
⚠️ Level yang Disarankan
Meskipun indikator tidak menampilkan level statis secara default, pengguna disarankan untuk menambahkannya secara manual melalui tab “Levels” di cTrader:
- Level 80 → Jenuh Beli
- Level 20 → Jenuh Jual
Level-level ini bekerja mirip dengan Stochastic Oscillator tradisional tetapi diterapkan pada perilaku RSI, membuat sinyal lebih tajam dan seringkali lebih cepat.
🧠 Cara Menggunakan
- Jenuh Beli (>80): Mungkin menunjukkan harga terlalu tinggi ke atas — potensi pembalikan atau konsolidasi.
- Jenuh Jual (<20): Mungkin menandakan harga terlalu rendah — kemungkinan pantulan atau pembalikan tren.
- Persilangan %K dan %D: Dapat digunakan mirip dengan Stochastic atau MACD — persilangan bullish di bawah 20 atau persilangan bearish di atas 80 mungkin dapat diambil tindakan.
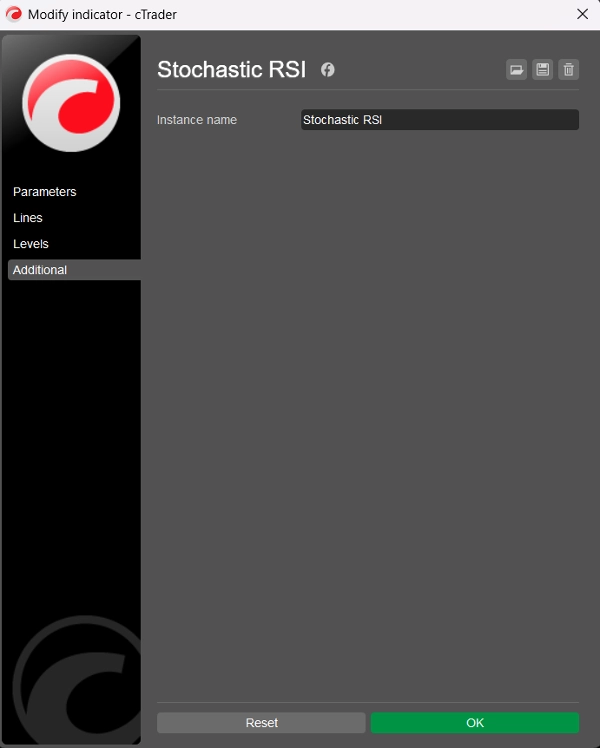
🏷️ Catatan
- Dibuat untuk cTrader menggunakan C# dan Automate API
- Bersih, efisien, dan dapat disesuaikan dengan 11 tipe MA
- Kode dan logika oleh BlueRocketBots & ChatGPT (OpenAI)
- Kode bersih (total 99 baris; 54 baris kode, 27 baris teks, 18 baris kosong)
- Versi V2 yang ditingkatkan
- Gratis!
Ringkasan
Key parameters include the RSI Period (default 14), Stochastic Period (default 14), %K and %D smoothing periods (default 3 each), and a choice among 11 moving average types for smoothing (default is Simple). The indicator outputs two lines: the %K line (smoothed Stochastic RSI) and the %D line (smoothed moving average of %K), both oscillating between 0 and 100.
Suggested manual levels for interpretation are 80 (overbought) and 20 (oversold). Traders may use these levels along with %K and %D crossovers to identify potential price reversals or consolidations. For example, a bullish crossover below 20 or a bearish crossover above 80 can signal actionable market moves.
The indicator is implemented in clean, efficient C# code using the Automate API, allowing customization and integration within cTrader.


