
50 percent
مؤشر
الإصدار 1.0، Aug 2025
Windows, Mac
5.0
التقييمات: 2

الوصف
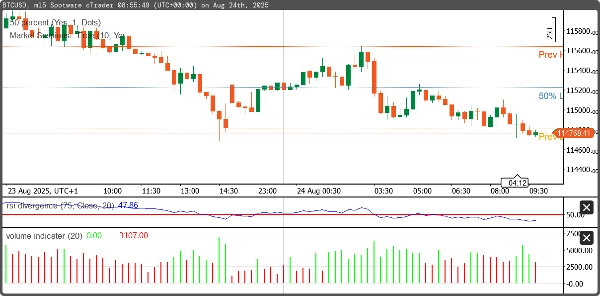
يقوم هذا cBot بالكشف تلقائيًا عن أعلى وأدنى أسعار الجلسة السابقة ويحسب النقطة الوسطى بينهما. تم تصميمه لمساعدة المتداولين من خلال تحديد مناطق الدعم/المقاومة الرئيسية ومستويات توازن السوق، والتي غالبًا ما تُستخدم لاستراتيجيات الانعكاس أو الاختراق.
- يكشف عن أعلى وأدنى سعر لليوم السابق (أو الجلسة).
- يحسب النقطة الوسطى بين الأعلى والأدنى.
- يرسم مستويات الأعلى والأدنى والنقطة الوسطى على الرسم البياني.
الملخص
ملف تعريف المؤشر
تقييمات العملاء
5.0
التقييمات: 2
5 | 100 % | |
4 | 0 % | |
3 | 0 % | |
2 | 0 % | |
1 | 0 % |
تقييمات العملاء
August 29, 2025
The screen feels less crowded, but the final call still needs say no.
August 20, 2025
مناقشة
الأسئلة الشائعة
يتم توفير المنتجات المتاحة من خلال cTrader Store، بما في ذلك روبوتات التداول والمؤشرات والإضافات، من قبل مطوري الطرف الثالث وإتاحتها لأغراض الوصول المعلوماتي والفني فقط. cTrader Store ليس وسيطًا ولا يقدم نصائح استثمارية أو توصيات شخصية أو أي ضمان للأداء المستقبلي.
المزيد من هذا المؤلف


السعر
منذ 14/05/2025
10.1M
حجم التداول
81.44K
الربح بالبيب
201
التثبيتات المجانية