Deskripsi
Indikator yang Menjadi Sistem Perdagangan
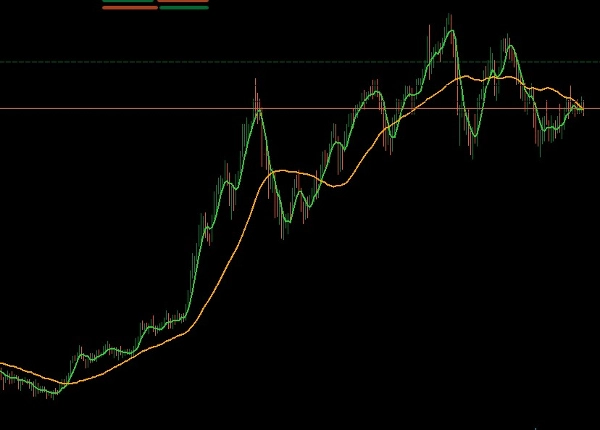
Indikator ini, ketika digunakan pada grafik mingguan, memang dapat menjadi sistem perdagangan yang lengkap. Kekuatan utamanya adalah menyaring kebisingan pasar yang khas dari kerangka waktu yang lebih pendek, hanya menunjukkan arah utama jangka panjang kepada Anda.
Strategi Perdagangan Berbasis Tren
Kondisi utama untuk keberhasilan adalah kemampuan trader untuk mengidentifikasi akhir dari pergerakan menyamping (konsolidasi). Ketika sebuah instrumen akhirnya menembus periode ketidakpastian ini dan indikator dengan yakin menunjukkan arah baru, itulah momen yang sempurna untuk masuk ke pasar.
Karena perdagangan dilakukan pada grafik mingguan, fokusnya adalah menangkap tren utama. Akibatnya, trader yang sabar yang memasuki pasar dengan tepat pada awal tren dapat mencapai keuntungan yang sangat baik dari satu perdagangan. Indikator ini berubah dari alat sederhana menjadi dasar strategi perdagangan yang sederhana namun kuat bagi mereka yang bersedia menunggu dan memperdagangkan tren utama.
Ringkasan
Ulasan pelanggan
5 | 0 % | |
4 | 100 % | |
3 | 0 % | |
2 | 0 % | |
1 | 0 % |