
SymbolTFOverlay
Indikator
119 unduhan
Versi 1.0, Sep 2025
Windows, Mac
Deskripsi
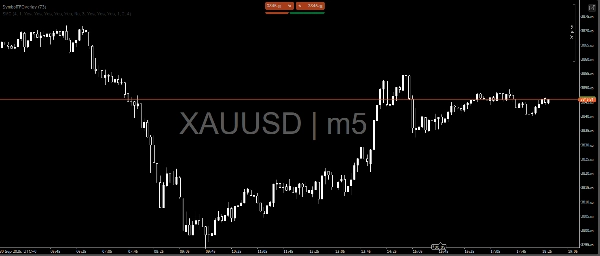
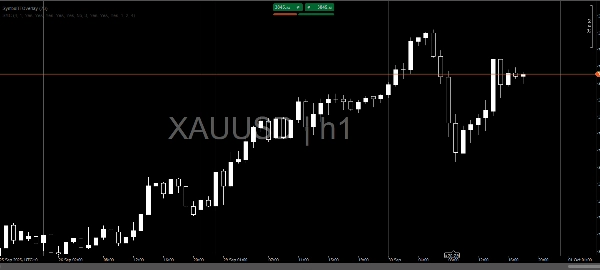
SymbolTFOverlay adalah indikator kustom untuk platform cTrader, dirancang untuk menampilkan simbol saat ini (misalnya, EURUSD) dan kerangka waktu (misalnya, H1) sebagai overlay teks semi-transparan pada grafik. Indikator ini meningkatkan keterbacaan grafik dengan menyediakan referensi visual yang jelas dan terpusat untuk informasi pasar utama.Fitur Utama:
- Tampilan Teks Dinamis: Menampilkan simbol dan kerangka waktu (misalnya, "EURUSD | H1") di tengah area grafik yang terlihat.
- Pembaruan Otomatis: Menyegarkan teks setiap kali bar baru terbentuk, memastikan teks tetap terpusat.
- Penampilan yang Dapat Disesuaikan: Ukuran font, warna, dan transparansi teks dapat disesuaikan dengan bebas.
- Pemantauan Efisien: Menggunakan timer (memeriksa setiap 2 detik) untuk mendeteksi perubahan pada area grafik yang terlihat, seperti zoom atau gulir, untuk reposisi teks yang mulus.
- Validasi yang Kuat: Menyertakan pemeriksaan untuk mencegah kesalahan dari indeks atau level harga yang tidak valid, memastikan kinerja yang andal di berbagai kondisi pasar.
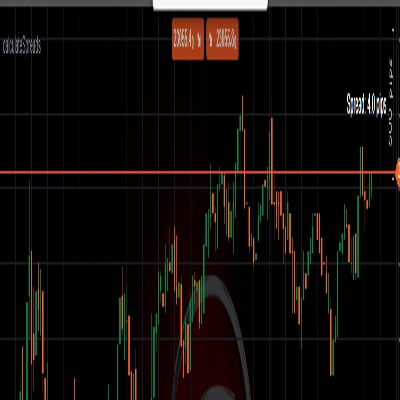
- Desain Overlay: Menampilkan teks langsung pada grafik tanpa membuatnya berantakan, menjaga pengalaman visual yang bersih.
Indikator ini ideal untuk trader yang membutuhkan akses cepat ke informasi simbol dan kerangka waktu saat menganalisis grafik, dengan penyesuaian otomatis untuk menjaga visibilitas optimal selama interaksi grafik yang dinamis.
Ringkasan
Ringkasan AI
SymbolTFOverlay is a custom indicator for the cTrader platform that displays the current trading symbol and timeframe as a semi-transparent text overlay centered on the chart. It dynamically updates the displayed text with each new bar formation to ensure accuracy. The indicator automatically repositions the overlay during chart interactions such as zooming or scrolling by checking the visible area every two seconds. Users can customize the font size, color, and transparency of the text to suit their preferences. Built-in validation prevents errors from invalid data, supporting reliable performance across various market conditions. The overlay design integrates the information directly on the chart without cluttering the visual space, enhancing chart readability. This indicator supports multiple market types including Forex, Indices, Commodities, Crypto, and Stocks. It is intended for traders who require immediate, clear reference to the current symbol and timeframe during technical analysis.
Profil indikator
Ulasan pelanggan
0.0
Ulasan: 0
Ulasan pelanggan
Belum ada ulasan untuk produk ini. Sudah mencobanya? Jadilah pemberi ulasan pertama!
Diskusi
Pertanyaan umum
Forex
Indices
Commodities
Crypto
Stocks
Produk-produk yang tersedia melalui cTrader Store, termasuk bot trading, indikator, dan plugin, disediakan oleh pengembang pihak ketiga serta hanya ditujukan untuk akses teknis dan informasi. cTrader Store bukan broker dan tidak menyediakan saran investasi, rekomendasi pribadi, atau jaminan apa pun tentang kinerja di masa mendatang.


Harga
Sejak 26/09/2025
119
Instal gratis