
Deskripsi
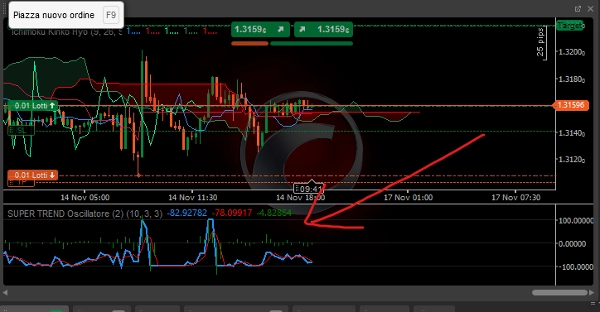
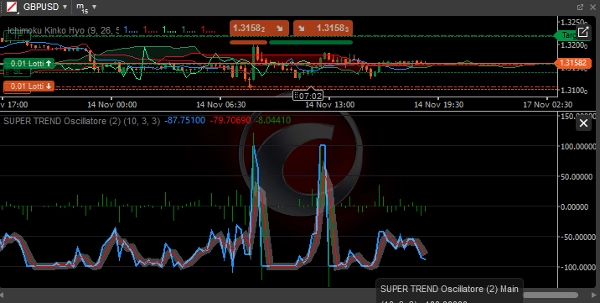
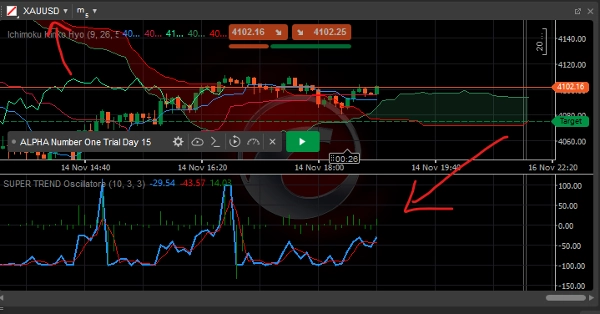
SUPER TREND Oscillatore
Simplified SuperTrend Oscillator - Deskripsi Lengkap
Ikhtisar
The Simplified SuperTrend Oscillator adalah indikator teknis canggih untuk cTrader yang mengubah SuperTrend klasik menjadi osilator visual, sehingga memudahkan identifikasi arah tren, kekuatan, dan keandalannya.
Komponen Utama
1. Garis Utama (Biru)
- Fungsi: Menampilkan jarak ternormalisasi antara harga dan garis SuperTrend
- Perhitungan:
((Price - SuperTrend) / (ATR × Multiplier)) × 100 - Interpretasi:
-
- > 0: Tren bullish (harga di atas SuperTrend)
- < 0: Tren bearish (harga di bawah SuperTrend)
- Rentang: Dari -100 hingga +100
2. Garis Sinyal (Merah)
- Fungsi: Rata-rata bergerak sederhana dari garis utama
- Periode: Dapat disesuaikan (default 3 periode)
- Penggunaan: Menyaring noise pasar dan mengonfirmasi sinyal
3. Histogram (Abu-abu)
- Fungsi: Selisih antara garis utama dan garis sinyal
- Interpretasi:
-
- Positif: Momentum bullish meningkat
- Negatif: Momentum bearish meningkat
- Perpotongan nol: Potensi pembalikan momentum
Parameter yang Dapat Disesuaikan
Parameter SuperTrend:
- Periode ATR: Periode untuk perhitungan Average True Range (default: 10)
- Pengali: Pengali untuk pita SuperTrend (default: 3.0)
Parameter Osilator:
- Periode Sinyal: Periode untuk garis sinyal (default: 3)
Interpretasi Sinyal
Kondisi Tren:
- Tren Bullish Kuat:
-
- Utama > +50
- Utama > Sinyal
- Histogram positif
- Tren Bearish Kuat:
-
- Utama < -50
- Utama < Sinyal
- Histogram negatif
- Pasar Ranging:
-
- Utama antara -30 dan +30
- Sering terjadi persilangan garis
Sinyal Trading:
Entry Long:
- Utama melintasi di atas 0
- Histogram menjadi positif
- Garis sinyal mengonfirmasi bullish
- Utama di atas +20 untuk momentum
Entry Short:
- Utama melintasi di bawah 0
- Histogram menjadi negatif
- Garis sinyal mengonfirmasi bearish
- Utama di bawah -20 untuk momentum
Keluar/Take Profit:
- Long: Utama > +80 (jenuh beli) atau melintasi di bawah Sinyal
- Short: Utama < -80 (jenuh jual) atau melintasi di atas Sinyal
Keuntungan Versi Sederhana
1. Performa Optimal
- Perhitungan lebih efisien
- Konsumsi sumber daya lebih rendah
- Respons lebih cepat terhadap perubahan harga
2. Kemudahan Penggunaan
- Parameter penting yang dikurangi
- Sinyal visual langsung
- Interpretasi mudah bahkan untuk trader pemula
3. Keandalan
- Kurang rentan terhadap noise
- Sinyal lebih bersih dan terdefinisi
- Sinyal palsu berkurang dibandingkan SuperTrend klasik
Strategi Penggunaan
Strategi Mengikuti Tren:
- Entry: Utama > 0 untuk long, Utama < 0 untuk short
- Filter: Histogram dengan tanda sama seperti Utama
- Keluar: Pembalikan tanda atau level ekstrem tercapai
Strategi Momentum:
- Entry: Utama > +30 (long) atau Utama < -30 (short)
- Konfirmasi: Histogram meningkat
- Keluar: Perlambatan momentum (histogram menurun)
Strategi Reversi Rata-rata:
- Entry: Utama > +80 (short) atau Utama < -80 (long)
- Konfirmasi: Pembalikan histogram
- Keluar: Kembali ke zona netral
Kondisi Pasar Optimal
Pasar Trending:
- Efisiensi tinggi
- Sinyal berkepanjangan
- Lebih sedikit whipsaw
Pasar Ranging:
- Kurangi ukuran lot
- Perpanjang kerangka waktu
- Gunakan sebagai filter momentum
Praktik Terbaik
Kerangka Waktu yang Direkomendasikan:
- Intraday: M15 - H1
- Swing Trading: H4 - D1
- Position Trading: W1 - MN
Manajemen Risiko:
- Stop Loss: 1.5-2 × ATR
- Take Profit: 2-3 × Risiko
- Ukuran Posisi: 1-2% per perdagangan
Konfirmasi Tambahan:
- Keselarasan kerangka waktu ganda
- Konfirmasi volume
- Level support/resistance kunci
Keterbatasan
Pertimbangan:
- Lag bawaan (indikator mengikuti tren)
- Performa menurun di pasar ranging
- Perlu konfirmasi di volatilitas rendah
Rekomendasi:
- Gabungkan dengan analisis aksi harga
- Gunakan sebagai filter, bukan sistem mandiri
- Uji coba demo sebelum penggunaan langsung
Osilator ini merupakan alat yang kuat untuk mengidentifikasi tren kuat dan menyaring sinyal palsu sambil mempertahankan kesederhanaan operasional yang cocok untuk trader pemula maupun berpengalaman.
Ringkasan
Ulasan pelanggan
5 | 67 % | |
4 | 33 % | |
3 | 0 % | |
2 | 0 % | |
1 | 0 % |


