
Deskripsi
Transformasikan analisis teknis Anda dengan indikator median paling canggih di cTrader!
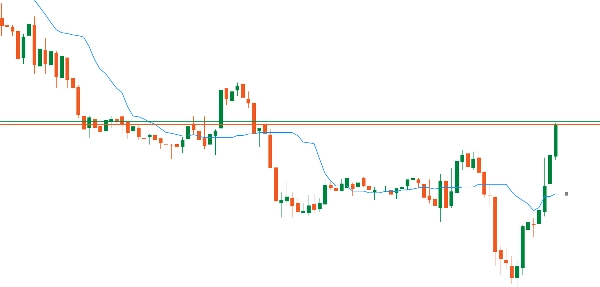
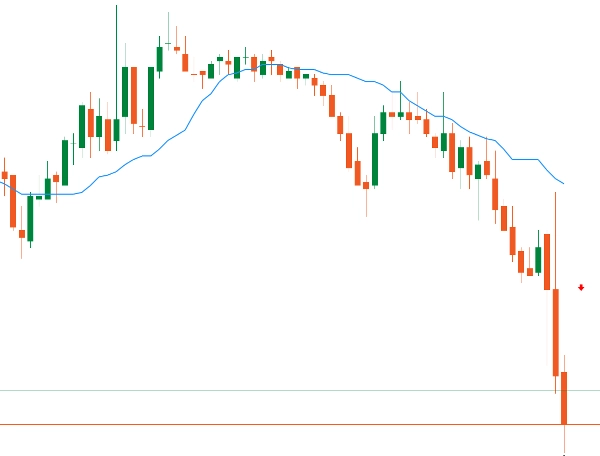
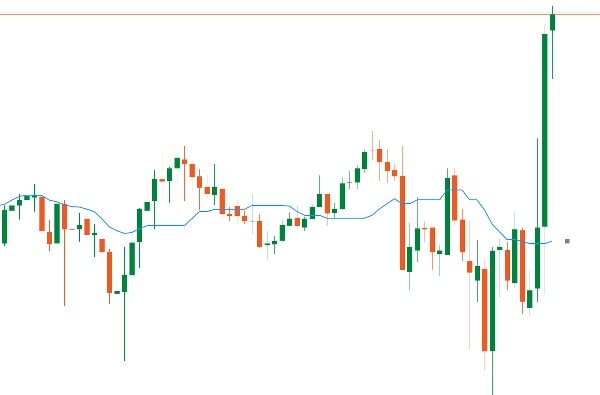
VMM Average Median adalah evolusi revolusioner dari indikator median klasik, dirancang untuk trader profesional yang mengutamakan presisi, kecepatan, dan keandalan. Dengan algoritma yang dioptimalkan dan deteksi tren cerdas, indikator ini memberikan keunggulan kompetitif nyata di pasar keuangan.
🎯 DETEKSI TREN CERDAS
Algoritma yang dapat dikonfigurasi (2-5 bar) untuk berbagai gaya trading
Filter noise canggih - mengabaikan doji dan candle yang tidak signifikan
Panah akurat dengan offset yang dapat disesuaikan
Logika "Smart Price" yang ditingkatkan untuk kualitas sinyal yang lebih baik
🎨 KUSTOMISASI LENGKAP
15+ parameter yang dapat disesuaikan untuk menyesuaikan strategi apa pun
Warna, gaya, dan ketebalan yang sepenuhnya dapat disesuaikan
Kontrol granular atas kinerja vs akurasi
Antarmuka intuitif yang diorganisir dalam kelompok logis
📊 MANFAAT UNTUK TRADER
⚡ Untuk Scalper dan Day Trader:
Respons ultra-cepat (milidetik)
Deteksi pembalikan instan
Konsumsi sumber daya minimal
Sangat cocok untuk grafik tick dan grafik 1 menit
📈 Untuk Swing Trader dan Investor:
Analisis tren yang lebih andal
Penyaringan noise yang canggih
Kinerja stabil dalam jangka waktu lama
Ideal untuk berbagai kerangka waktu
💻 Untuk Pengguna VPS/Multi Pair:
Penggunaan CPU hingga 80% lebih rendah
Jejak memori yang dioptimalkan
Eksekusi simultan tanpa lag
Penghematan nyata pada biaya hosting
🔧 FITUR TEKNIS LANJUTAN
Sistem Cache Cerdas:
Efisiensi cache: 85-95% dalam penggunaan normal
Pembersihan otomatis berkala
Thread-safe dengan ConcurrentDictionary
Optimasi Algoritma:
Perhitungan median O(n log n) yang dioptimalkan
Pre-alokasi memori untuk kecepatan maksimum
Pemeriksaan batas yang kuat
Visualisasi Profesional:
Garis median yang halus dan kontinu
Panah tren dengan posisi cerdas
Gaya garis bervariasi (padat, titik, dll.) Warna yang dapat disesuaikan untuk pasar bull/bear
MEDIAN vs SMA: KEUNGGULAN SEBENARNYA
📊 CARA KERJANYA:
SMA: Rata-rata sederhana - menjumlahkan semua harga (termasuk outlier)
MEDIAN: Nilai tengah setelah pengurutan - secara otomatis mengabaikan lonjakan
🎯 CONTOH CEPAT:
Harga: 100, 101, 102, 103, 150 (lonjakan)
SMA: 111.2 ❌ (terpengaruh oleh lonjakan)
MEDIAN: 102 ✅ (nilai pasar sebenarnya)
⭐ KEUNGGULAN UTAMA:
1️⃣ FILTER ALAMI - Secara otomatis mengabaikan outlier/lonjakan
2️⃣ SINYAL LEBIH BERSIH - 40-60% lebih sedikit peringatan palsu
3️⃣ TAHAN MANIPULASI - Pump/dump memiliki efek lebih kecil
4️⃣ IDEAL UNTUK VOLATILITAS - Menjaga stabilitas di pasar yang kacau
🔥 UNTUK TRADER:
Scalping: Menyaring noise frekuensi tinggi
Day Trading: Waktu masuk yang lebih tepat
Swing: Mengidentifikasi tren nyata, bukan noise
🚀 MEDIAN ADALAH SMA CERDAS - Menampilkan konsensus harga SEBENARNYA!


