Descripción
Mapa de Calor de Liquidez - Análisis Profesional de Pivotes Multitemporales
Transforma tu trading con una visualización avanzada de liquidez. Este potente indicador revela zonas de liquidez institucional analizando puntos pivote en 10 marcos temporales diferentes simultáneamente, creando un mapa de calor dinámico que muestra exactamente dónde es probable que esté posicionado el dinero inteligente.
Cómo Funciona
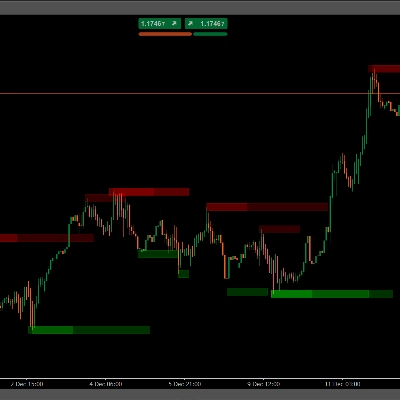
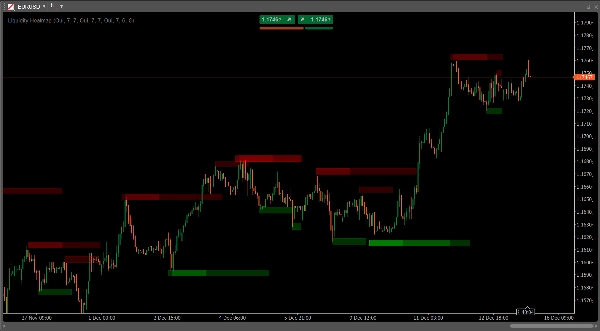
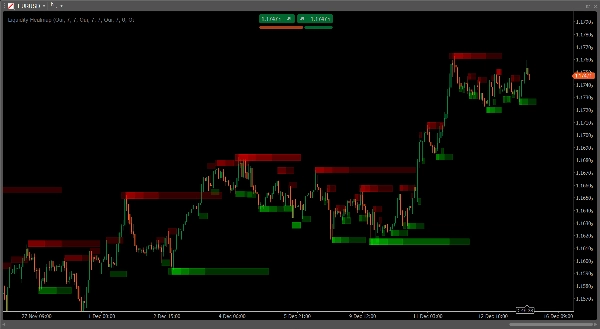
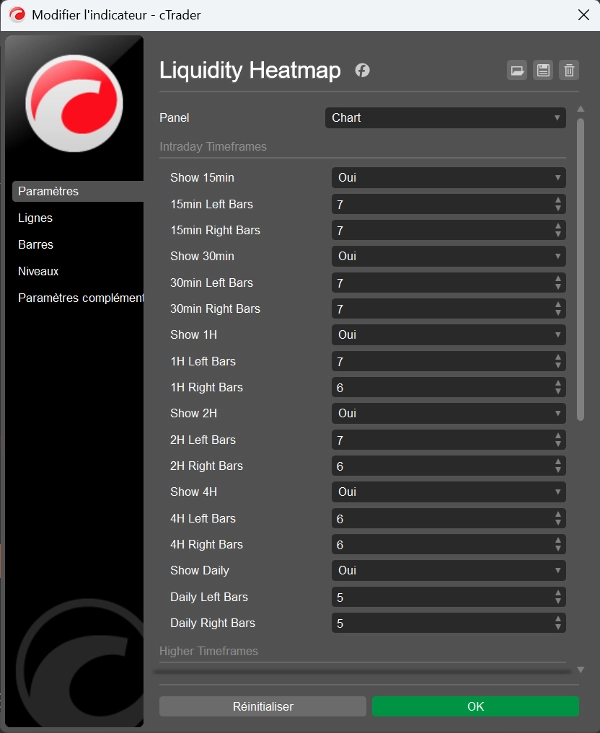
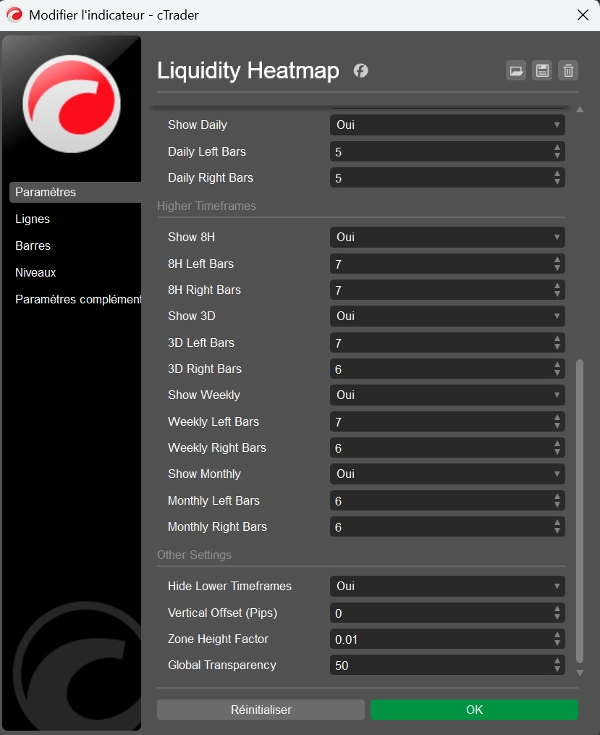
El indicador detecta máximos y mínimos pivote en múltiples marcos temporales (15min, 30min, 1H, 2H, 4H, Diario, 8H, 3D, Semanal, Mensual) y superpone zonas semitransparentes en cada nivel pivote. Donde convergen múltiples pivotes de diferentes marcos temporales, las zonas se apilan e intensifican en color, creando una "firma térmica" que revela los niveles de liquidez más fuertes en tu gráfico.
Características Clave
- 10 Marcos Temporales Personalizables: Analiza desde intradía (15min) hasta perspectivas a largo plazo (Mensual) simultáneamente
- Mapeo de Densidad Inteligente: Las zonas superpuestas crean automáticamente áreas más oscuras que muestran la confluencia de liquidez
- Detección de Pivote Totalmente Ajustable: Configura barras izquierda/derecha (2-20) para cada marco temporal de forma independiente
- Visualización Adaptativa: La altura de la zona se escala automáticamente con el zoom del gráfico para una apariencia consistente
- Zonas Ancladas en el Tiempo: Las zonas permanecen fijas en su tiempo exacto de formación, sin desplazarse en tu gráfico
- Transparencia Personalizable: Controla la transparencia global (0-255) para adaptar el estilo de tu gráfico
- Filtrado Inteligente de Marcos Temporales: Opción para ocultar marcos temporales inferiores según la vista actual de tu gráfico
- Control de Desplazamiento Vertical: Ajusta finamente la posición de la zona con ajuste basado en pips
- Codificación de Color Separada: Zonas rojas para máximos pivote (resistencia), verdes para mínimos pivote (soporte)
Perfecto Para
- Traders de Conceptos de Dinero Inteligente (SMC) identificando piscinas de liquidez
- Seguidores de la metodología ICT rastreando niveles institucionales
- Traders swing buscando zonas de reversión de alta probabilidad
- Scalpers identificando capturas de liquidez intradía
- Cualquier trader que busque confluencia a través de múltiples marcos temporales
Aplicaciones de Trading
El mapa de calor revela dónde se agrupan los stop loss y dónde probablemente descansan las órdenes institucionales. Usa estas zonas para:
- Anticipar barridos de liquidez y reversiones
- Identificar confluencias fuertes de soporte/resistencia
- Encontrar puntos de entrada óptimos después de capturas de liquidez
- Establecer stop loss estratégicos más allá de zonas clave de liquidez
- Confirmar la validez de rupturas observando el consumo de liquidez
Por Qué Este Indicador Destaca
A diferencia de los indicadores pivote básicos que muestran niveles de un solo marco temporal, este mapa de calor agrega datos de 10 marcos temporales simultáneamente, ofreciéndote una vista completa de la estructura del mercado. La visualización de densidad te muestra instantáneamente qué niveles tienen mayor importancia: cuanto más oscura es la zona, más marcos temporales coinciden en ese nivel de liquidez.
Optimizado para Rendimiento
Procesa eficientemente hasta 500 barras por marco temporal con gestión inteligente de objetos, asegurando un rendimiento fluido del gráfico incluso con todos los marcos temporales habilitados.
Fácil Configuración
Instala y comienza a operar inmediatamente con configuraciones predeterminadas optimizadas, o personaliza cada parámetro para que coincida con tu estrategia y estilo de trading específicos.
Eleva tu análisis de liquidez y opera con la visión del flujo de órdenes institucional. Perfecto para traders que entienden que el precio no se mueve al azar, sino que se mueve hacia la liquidez.
Resumen
Key features include customizable pivot detection parameters for each timeframe, adaptive zone visualization that scales with chart zoom, and separate color coding for resistance (red) and support (green) zones. The indicator also offers adjustable transparency, vertical offset control, and smart timeframe filtering to hide lower timeframes based on the current chart view.
This tool is suitable for traders using Smart Money Concepts, ICT methodology, swing trading, scalping, or any strategy requiring multi-timeframe liquidity analysis. It helps identify clusters of stop losses and institutional orders to anticipate liquidity sweeps, reversals, strong support/resistance levels, optimal entry points, strategic stop losses, and breakout confirmations.
Liquidity Heatmap efficiently processes up to 500 bars per timeframe with optimized object management, ensuring smooth performance. It supports various markets including Forex, Crypto, Stocks, Indices, and Commodities. The indicator comes with optimized default settings and full customization options to fit different trading styles.
Valoraciones de clientes
5 | 100 % | |
4 | 0 % | |
3 | 0 % | |
2 | 0 % | |
1 | 0 % |


