説明
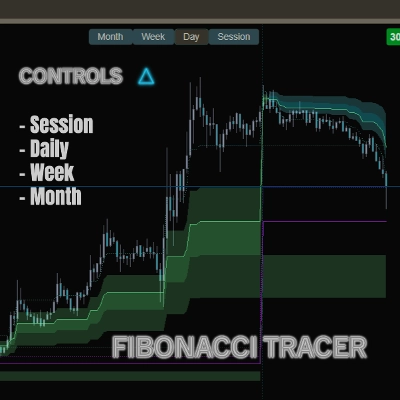
フィボナッチトレーサーはフィボナッチレベルを自動的に描画および更新し、その発展の可視的な痕跡を残します。
これにより、静的なレベルだけでなく、フィボナッチが市場とともに時間とともにどのように進化するかを見ることができます。これは孤立した線よりもはるかに重要です。
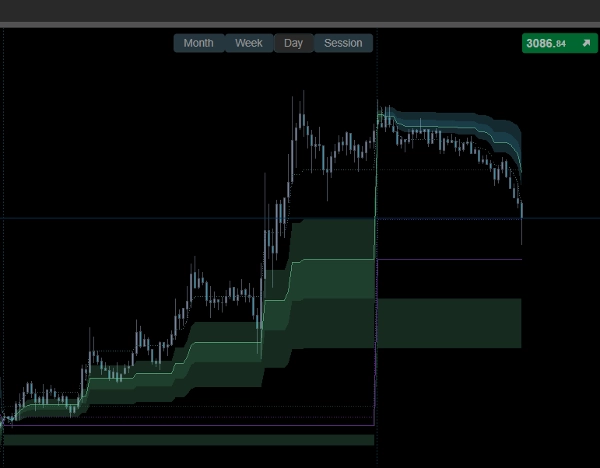
チャート上のクイックコントロールボタンで、セッション、日次、週次、月次のビューを即座に切り替えられるため、異なる時間軸でフィボナッチの進行を追跡できます。
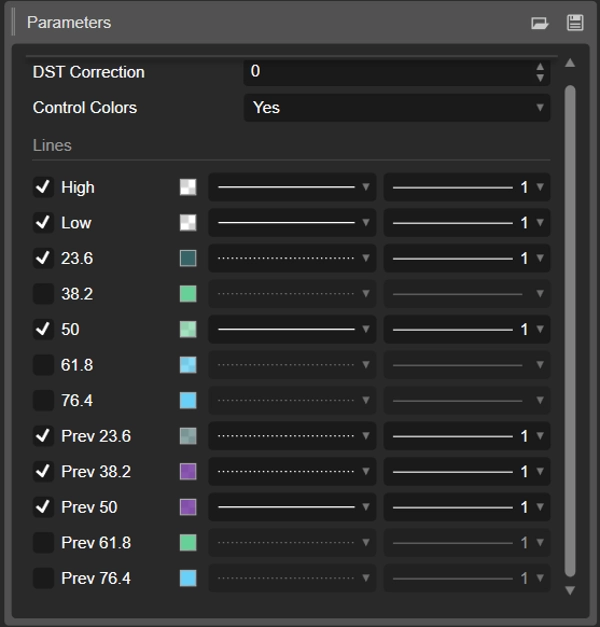
インジケーターを有効にした後、設定を開いて線のチェックボックスをオフにしてください(下の画像のように)。これにより不要な点が除去され、カバー画像と同じ柔らかく目に優しい配色になります。
ほとんどのインジケーターは重要な詳細を見落としています — 市場の移行、週末や夜間のロールオーバー(流動性がゼロにリセットされる時)を無視し、リセットと新しい市場の読み取りが実際に必要なところで計算を続けています。これは私の経験のほんの一部ですが、これを理解するだけで市場の見方が変わるでしょう。
概要
インジケーターのプロフィール
カスタマーレビュー
4.5
レビュー: 2
5 | 50 % | |
4 | 50 % | |
3 | 0 % | |
2 | 0 % | |
1 | 0 % |
ディスカッション
よくあるご質問
BTCUSD
Fibonacci
Prop
Forex
Signal
Scalping
Indices
EURUSD
Commodities
Crypto
Stocks
cTrader Storeで入手可能な取引ボット、インジケーター、プラグインなどの商品は、第三者の開発者が提供するものであり、情報と技術の取得のみを目的としてご利用いただけます。cTrader Storeはブローカーではなく、投資助言や個人的な推奨を行うことも、将来のパフォーマンスを保証することもありません。


![「High-Low Divergence [Iridio Capital]」ロゴ](https://cdn.ctrader.com/image/webp/443c4661-7abb-40f1-842f-4b6ec560649b_40914)


価格
700.93M
取引数量
228.68K
獲得pips