
APA YANG DILAKUKANNYA
Donchian Channel dengan Konteks Timeframe menampilkan batas struktural timeframe yang lebih tinggi ke grafik Anda saat ini — memberikan setiap breakout dan pullback sebuah kerangka acuan yang tidak disediakan oleh channel Donchian standar.
Channel Donchian standar menggambar harga tertinggi dan terendah selama periode lookback tetap pada timeframe Anda saat ini. Ini efektif untuk identifikasi breakout — tetapi beroperasi secara terpisah. Breakout pada grafik 15 menit mungkin hanyalah kebisingan dalam rentang Mingguan.
Indikator ini menambahkan konteks yang hilang itu.
Indikator ini menghitung rentang periode timeframe yang lebih tinggi sebelumnya dan memproyeksikannya sebagai zona support/resistance pada grafik eksekusi Anda. Anda melihat keduanya: Channel Donchian standar yang melacak ekstrem harga timeframe saat ini, dan konteks timeframe yang lebih tinggi yang menunjukkan di mana harga berada relatif terhadap batas struktural yang lebih besar.
Hasilnya adalah Channel Donchian yang mengetahui posisinya dalam gambaran yang lebih besar.
MENGAPA KONTEKS TIMEFRAME PENTING
Channel Donchian adalah salah satu sistem breakout yang paling dihormati dalam trading. Konsep asli Richard Donchian — beli harga tertinggi, jual harga terendah — tetap menjadi dasar strategi mengikuti tren. Namun channel saja tidak memberi tahu Anda apakah breakout yang Anda lihat signifikan secara struktural.
Masalahnya
Breakout Donchian standar pada timeframe grafik Anda menciptakan serangkaian frustrasi umum:
- Harga menembus di atas channel atas pada H1 — tetapi rentang Mingguan memberi tahu Anda itu menghadapi resistance, bukan memulai tren
- Harga menguji channel bawah pada M15 — tetapi konteks Harian menunjukkan permintaan kuat di bawah yang belum diuji
- Anda memasuki perdagangan breakout dengan percaya diri — hanya untuk melihat harga berbalik karena pergerakan itu bersifat korektif dalam struktur timeframe yang lebih besar
Ini bukan kegagalan indikator. Ini kegagalan konteks. Channel bekerja persis seperti yang dirancang — hanya saja tidak mengetahui batas struktural satu timeframe di atasnya.
Solusinya
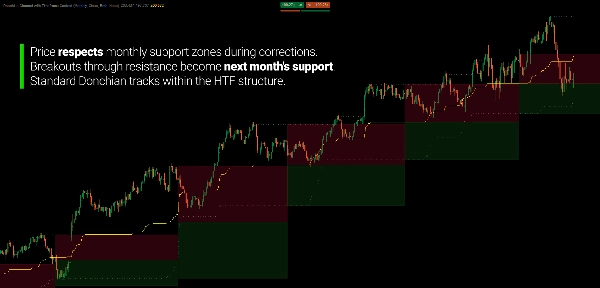
Indikator ini memproyeksikan rentang Donchian periode timeframe yang lebih tinggi sebelumnya sebagai zona visual pada grafik Anda saat ini. Ketika harga mendekati garis channel standar atas atau bawah, Anda langsung melihat apakah harga menuju ke atau menjauh dari batas timeframe yang lebih tinggi.
Zona timeframe yang lebih tinggi membagi periode saat ini menjadi wilayah resistance (di atas titik tengah) dan wilayah support (di bawah titik tengah) — memberi Anda bias struktural sebelum breakout terjadi.
KONSEP INTI
Jawaban Donchian tradisional: "Apa harga tertinggi dan terendah selama N bar terakhir?"
Indikator ini menambahkan: "Di mana rentang itu berada relatif terhadap rentang periode timeframe yang lebih tinggi sebelumnya?"
Sistem bekerja dalam dua lapisan:
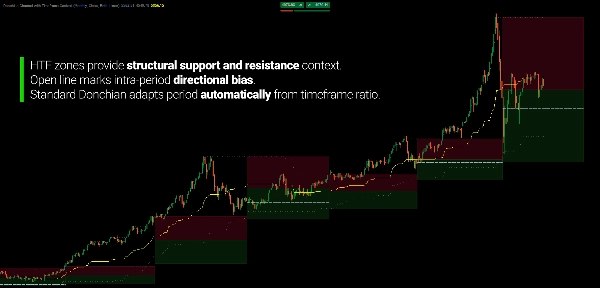
- Channel Donchian Standar dihitung pada grafik Anda saat ini dengan periode yang disesuaikan secara otomatis. Periode ini berasal dari rasio antara konteks timeframe yang Anda pilih dan timeframe grafik Anda — tanpa pengaturan manual. Konteks Mingguan pada grafik H1 secara otomatis menggunakan lookback 120 bar (5 hari × 24 jam ÷ 1 jam).
- Zona Konteks Timeframe menghitung harga tertinggi dan terendah dari periode timeframe yang lebih tinggi sebelumnya, lalu memproyeksikan level tersebut sebagai zona berwarna di seluruh periode saat ini. Zona support meluas dari batas bawah ke titik tengah. Zona resistance meluas dari titik tengah ke batas atas.
Ketika breakout Donchian standar terjadi dalam zona support, konteks timeframe yang lebih tinggi menunjukkan pergerakan memiliki ruang. Ketika terjadi dalam zona resistance, konteks menunjukkan kewaspadaan — breakout menekan terhadap supply struktural yang lebih besar.
APLIKASI PRAKTIS
Penyaringan False Breakout
Kasus penggunaan utama. Ketika harga menembus di atas garis channel atas standar tetapi sudah dalam zona resistance HTF, breakout membawa risiko pembalikan yang lebih tinggi. Zona ini memberikan konteks untuk membedakan antara ekspansi nyata dan probing yang melelahkan ke dalam supply overhead.
Sebaliknya, breakout yang terjadi dekat titik tengah HTF memiliki ruang struktural lebih untuk berkembang sebelum menghadapi batas yang lebih besar.
Kelelahan Koreksi
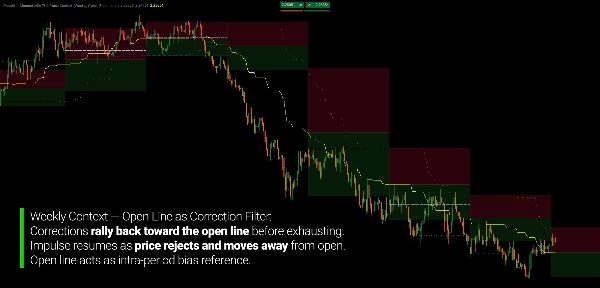
Selama pullback dalam tren, zona support/resistance HTF memberi Anda referensi struktural tentang di mana koreksi mungkin habis. Pullback yang mencapai batas zona support HTF menunjukkan penjual mungkin telah menghabiskan energinya pada level struktural — bersiaplah untuk potensi pembalikan. Pullback yang berhenti sebelum mencapai zona menunjukkan tren tetap kuat.
Posisi Struktural
Sebelum sinyal breakout muncul, zona memberi tahu Anda di mana harga saat ini berada dalam rentang timeframe yang lebih tinggi. Setengah atas rentang HTF = kewaspadaan untuk posisi long. Setengah bawah = kewaspadaan untuk posisi short. Dekat titik tengah = zona netral di mana arah kurang jelas.
Referensi Harga Open
Garis harga open opsional menandai di mana periode timeframe yang lebih tinggi saat ini dibuka. Ini memberikan referensi tambahan untuk bias intra-periode — harga di atas open menunjukkan kontrol bullish, di bawah menunjukkan kontrol bearish.
FITUR UTAMA
Sistem Donchian Dua Lapis
- Channel Donchian standar dengan periode yang dihitung otomatis berdasarkan rasio timeframe
- Zona konteks timeframe yang lebih tinggi diproyeksikan sebagai support/resistance pada grafik saat ini
- Kedua lapisan diperbarui secara real-time saat data harga baru tiba
Perhitungan Periode Otomatis
- Periode berasal dari rasio antara timeframe konteks dan timeframe grafik
- Tidak ada pengaturan periode manual — timeframe konteks menentukan lookback secara otomatis
- Mendukung grafik non-berbasis waktu (Tick, Renko, Range) dengan default yang dapat dikonfigurasi
Opsi Konteks Timeframe
- 13 pilihan timeframe: Bulanan hingga Menit 15
- Terapkan konteks Mingguan pada grafik H1, konteks Harian pada grafik M5, atau kombinasi valid lainnya
- Zona diperbarui setiap kali periode timeframe yang lebih tinggi baru dimulai
Tampilan Zona Visual
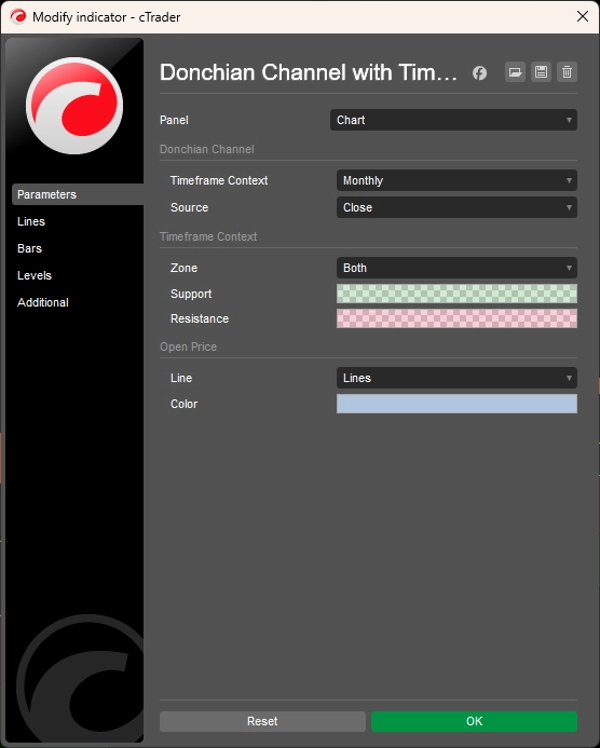
- Zona support (batas bawah ke titik tengah) — warna dapat dikonfigurasi dengan transparansi
- Zona resistance (titik tengah ke batas atas) — warna dapat dikonfigurasi dengan transparansi
- Mode tampilan: Kedua zona, hanya Support, hanya Resistance, atau Tidak ada
- Zona diproyeksikan ke depan hingga akhir periode HTF saat ini
Garis Harga Open
- Menandai harga pembukaan periode timeframe yang lebih tinggi saat ini
- Enam opsi gaya garis: Solid, Dots, DotsRare, DotsVeryRare, Lines, LinesDots
- Warna dapat dikonfigurasi — atau nonaktifkan sepenuhnya
Fleksibilitas Sumber Harga
- Perhitungan berbasis penutupan: menggunakan harga penutupan untuk batas channel
- Perhitungan berbasis HighLow: menggunakan sumbu tinggi/rendah untuk batas channel yang lebih lebar
- Satu pengaturan berlaku untuk perhitungan standar dan konteks
MEMBACA GRAFIK
- Zona Hijau: Wilayah support — rentang bawah periode HTF sebelumnya diproyeksikan ke depan
- Zona Merah: Wilayah resistance — rentang atas periode HTF sebelumnya diproyeksikan ke depan
- Batas Zona (atas): Harga tertinggi periode HTF sebelumnya
- Batas Zona (bawah): Harga terendah periode HTF sebelumnya
- Titik Tengah Zona: Tempat bertemunya zona support dan resistance — keseimbangan periode sebelumnya
- Garis Channel Standar: Donchian atas/bawah/tengah timeframe saat ini
- Garis Open: Tempat periode HTF saat ini dibuka
Penilaian Breakout:
- Breakout standar KE dalam zona support HTF → sejalan tren, ruang struktural
- Breakout standar KE dalam zona resistance HTF → berlawanan struktural, risiko pembalikan lebih tinggi
- Breakout standar MELAMPAUI zona HTF → wilayah baru, struktur sebelumnya tidak lagi menahan harga
UNTUK SIAPA INI
Indikator ini dirancang untuk trader yang menggunakan channel Donchian untuk trading breakout dan menginginkan konteks struktural timeframe yang lebih tinggi untuk memfilter sinyal mereka.
Jika Anda pernah mengalami frustrasi memasuki breakout Donchian yang langsung berbalik — karena mereka menekan batas struktural yang lebih besar yang tidak bisa Anda lihat — alat ini memberikan visibilitas tersebut.
Ini sangat cocok untuk trader pengikut tren yang menginginkan kriteria objektif untuk membedakan antara breakout asli dan probing yang melelahkan ke dalam supply atau demand overhead. Analis multi-timeframe akan mendapat manfaat dari melihat konteks rentang timeframe yang lebih tinggi langsung pada grafik eksekusi tanpa harus berganti timeframe.
Trader swing dapat menggunakan zona HTF sebagai referensi struktural untuk entri pullback — mengidentifikasi di mana koreksi kemungkinan akan habis berdasarkan batas periode sebelumnya. Trader diskresioner mendapatkan lapisan struktural tambahan untuk konteks tanpa menambah kompleksitas indikator.
Ini bukan sistem sinyal. Ini adalah overlay kontekstual yang membantu Anda mengevaluasi breakout Donchian dalam kerangka struktur pasar timeframe yang lebih tinggi.
APA YANG MEMBUATNYA BERBEDA
Indikator Channel Donchian standar beroperasi pada satu timeframe dengan periode tetap. Mereka memberi tahu Anda kapan harga melewati ekstrem terbaru — tetapi tidak tentang apakah ekstrem itu penting secara struktural.
Indikator ini memperkenalkan kesadaran timeframe yang lebih tinggi langsung ke dalam kerangka Donchian. Zona konteks menjawab pertanyaan yang tidak bisa dijawab channel standar: Apakah breakout ini menekan supply struktural? Apakah pullback ini mencapai demand struktural? Di mana saya berada dalam rentang yang lebih besar?
Perhitungan periode otomatis menghilangkan sumber kecemasan parameter yang umum. Alih-alih memilih antara lookback 20, 50, atau 100 bar, periode berasal secara alami dari hubungan timeframe. Konteks Mingguan pada grafik per jam menghasilkan lookback yang tepat secara otomatis — tanpa perlu optimasi.
Hasilnya adalah Channel Donchian yang beroperasi dengan kesadaran struktural, bukan secara terpisah.
---
MEMAHAMI KONTEKS MULTI-TIMEFRAME DALAM TRADING BREAKOUT
Trading breakout sederhana dalam konsep: harga melewati batas rentang, menunjukkan komitmen arah. Tantangannya bukan mengidentifikasi breakout — tetapi membedakan antara breakout yang mengarah ke tren dan breakout yang langsung gagal.
Sebagian besar false breakout memiliki karakteristik umum: mereka terjadi pada level yang signifikan secara struktural pada timeframe yang lebih tinggi. Breakout 15 menit ke resistance Mingguan bukanlah breakout dari perspektif Mingguan — itu adalah pengujian batas yang diketahui.
Inilah sebabnya konteks multi-timeframe sangat penting untuk evaluasi breakout. Breakout itu sendiri terjadi pada timeframe eksekusi Anda. Namun signifikansinya ditentukan oleh di mana breakout itu terjadi dalam struktur timeframe yang lebih tinggi.
Indikator yang menyediakan konteks ini tidak memprediksi breakout mana yang akan berhasil. Mereka membantu Anda memahami lingkungan struktural di mana setiap breakout terjadi — sehingga Anda dapat mengevaluasi risiko dengan lebih akurat dan menghindari mengambil posisi yang melawan struktur yang lebih besar.
Timeframe yang lebih tinggi tidak menggantikan timeframe yang lebih rendah. Ia memberikan konteks.
---
Trading melibatkan risiko. Indikator ini adalah alat analisis teknikal — selalu terapkan manajemen risiko yang tepat.


