
📊 Bảng Điều Khiển Phạm Vi Pip Hàng Ngày (Công Cụ ADR Đồng Bộ Phiên)
The Bảng Điều Khiển Phạm Vi Pip Hàng Ngày là một tiện ích giao dịch chuyên nghiệp hiển thị thống kê phạm vi hàng ngày theo thời gian thực trực tiếp trên biểu đồ của bạn — hoàn toàn đồng bộ với phiên UTC của nhà môi giới.
Được thiết kế cho các nhà giao dịch chính xác, công cụ này tính toán phạm vi pip Cao-Thấp sử dụng ranh giới hàng ngày dựa trên phiên thực tế và cung cấp các thống kê cuộn mạnh mẽ để phân tích bối cảnh thị trường và biến động.
🔥 Tính Năng Chính
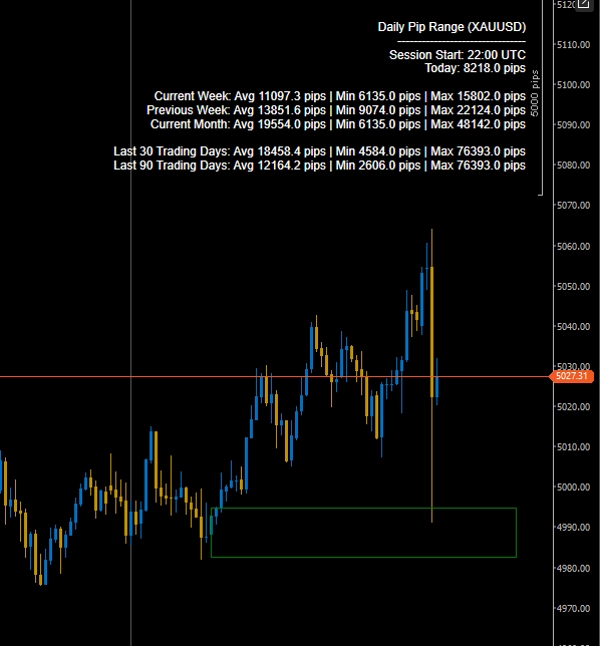
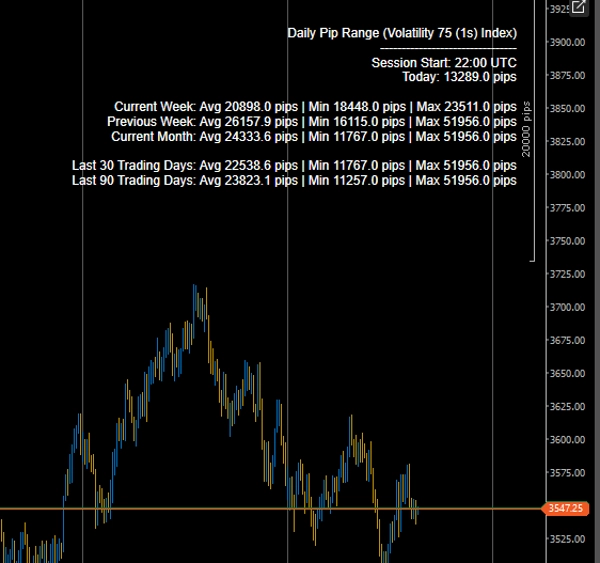
✅ Phạm Vi Hàng Ngày Trực Tiếp Hôm Nay (Cao–Thấp tính bằng Pips)
Xem phạm vi pip của phiên hiện tại cập nhật theo thời gian thực.
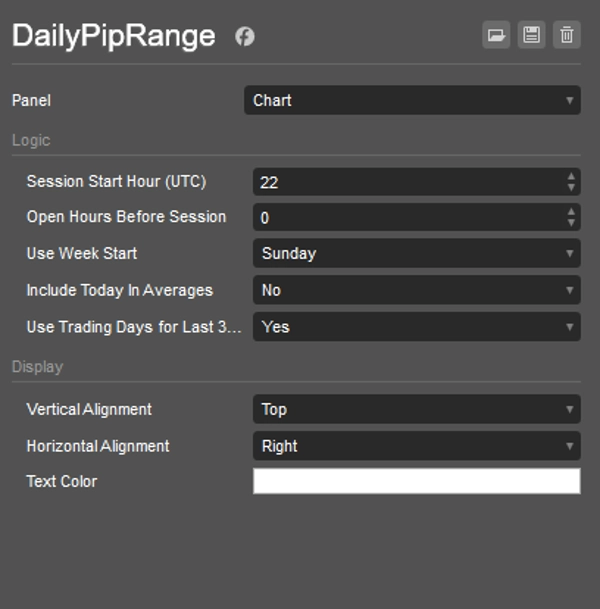
✅ Tính Toán Đồng Bộ Phiên (Kiểm Soát UTC)
Xác định:
- Giờ Bắt Đầu Phiên (UTC)
- Số Giờ Mở Trước Phiên
Điều này đảm bảo thống kê hàng ngày của bạn phù hợp với ngày giao dịch của nhà môi giới — lý tưởng cho việc đồng bộ đóng cửa NY và phân tích theo phong cách tổ chức.
✅ Phân Tích Thống Kê Nâng Cao
Cho mỗi khoảng thời gian, chỉ báo hiển thị:
- Phạm Vi Trung Bình Hàng Ngày
- Phạm Vi Tối Thiểu Hàng Ngày
- Phạm Vi Tối Đa Hàng Ngày
Các khoảng thời gian bao gồm:
- Tuần Hiện Tại
- Tuần Trước
- Tháng Hiện Tại
- 30 Ngày Qua
- 90 Ngày Qua
✅ Chuyển Đổi Ngày Giao Dịch hoặc Ngày Lịch
Chọn giữa:
- 30/90 ngày lịch gần đây
- 30/90 ngày giao dịch gần đây (chỉ thanh hàng ngày)
Hoàn hảo để lọc ra cuối tuần và các khoảng trống không giao dịch.
✅ Hiển Thị Tùy Chỉnh
- Vị trí màn hình có thể điều chỉnh (góc trên bên phải, v.v.)
- Tùy chỉnh màu chữ
- Lớp phủ nhẹ và không gây cản trở
🎯 Tại Sao Nên Sử Dụng Công Cụ Này?
- Xác định sự mở rộng và co lại của biến động
- So sánh phạm vi hôm nay với trung bình lịch sử
- Phát hiện sự nén trước khi bứt phá
- Lọc giao dịch dựa trên bối cảnh ADR
- Cải thiện kích thước rủi ro dựa trên điều kiện biến động
Dù bạn giao dịch trong ngày, giao dịch swing hay vàng, công cụ này cung cấp cho bạn thông tin biến động ngay lập tức mà không gây rối mắt.
⚙️ Phù Hợp Cho
- Nhà Giao Dịch Forex
- Nhà Giao Dịch Vàng (XAUUSD)
- Nhà Giao Dịch Chỉ Số
- Hệ Thống Dựa Trên Biến Động
- Nhà Giao Dịch Bứt Phá
- Phân Tích Phạm Vi Theo Phong Cách Tổ Chức
🚀 Nhận Thức Biến Động Chuyên Nghiệp - Trực Tiếp Trên Biểu Đồ Của Bạn
Được xây dựng cho hiệu suất, độ chính xác và sự chính xác theo phiên.
5 | 50 % | |
4 | 50 % | |
3 | 0 % | |
2 | 0 % | |
1 | 0 % |


