
Descrição
Market Structure Pro – Linhas de Tendência, Zonas e Entradas Inteligentes
Market Structure Pro é um conjunto completo de ferramentas de price-action que mapeia automaticamente a estrutura de oscilação do mercado, suportes/resistências chave, verdadeiras linhas de tendência e zonas HH/LL—e opcionalmente destaca entradas de pullback de alta probabilidade com lógica de confirmação integrada.
Em vez de desenhar tudo manualmente, o indicador escaneia continuamente seu gráfico em segundo plano e mantém sua estrutura, zonas e sinais atualizados em tempo real.
O que este indicador faz
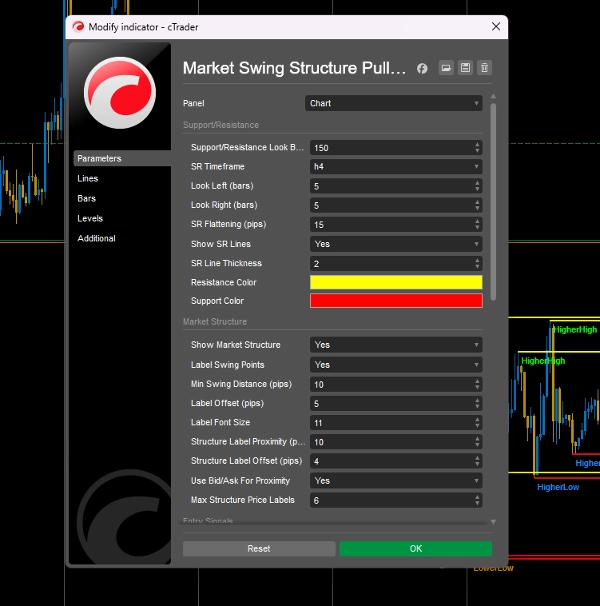
- Suporte e Resistência Automáticos
-
- Detecta máximas/mínimas de oscilação em um intervalo configurável de retrocesso.
- Achatamento de níveis próximos em zonas mais limpas usando uma tolerância em pips.
- Desenha linhas SR interativas em qualquer timeframe selecionado (ex: SR 4H em entradas M15).
- Espessura e cores totalmente personalizáveis para suporte e resistência.
- Verdadeiras Linhas de Tendência Externas
-
- Constrói linhas de tendência ascendentes/descendentes de suporte e resistência a partir de pontos de oscilação validados.
- Controles para limitar quantas linhas de tendência por direção são exibidas e para estendê-las para o futuro.
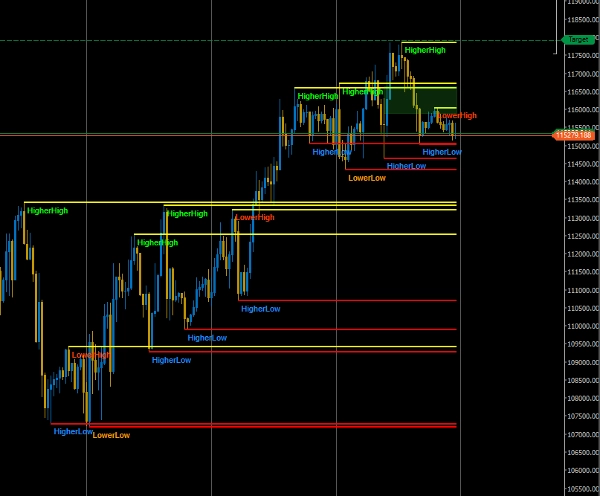
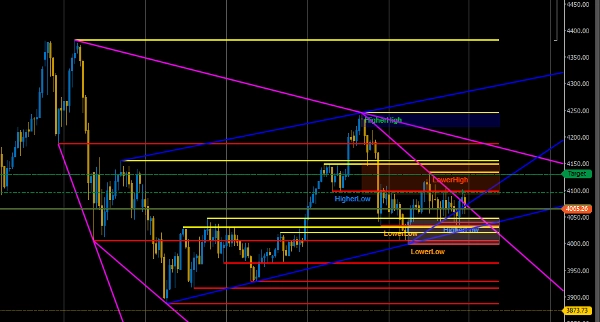
- Mapeamento da Estrutura do Mercado (HH, HL, LH, LL)
-
- Rotula oscilações de Higher High, Higher Low, Lower High, Lower Low diretamente no gráfico.
- Distância mínima ajustável de oscilação (pips) para remover ruído do mercado.
- Limita o número de rótulos ativos para manter seu gráfico limpo.
- Texto ao vivo mostrando “Tendência Atual” (Alta / Baixa / Lateral, com notas de reversão).
- Mensagem integrada de “Previsão da Próxima Estrutura” para fornecer contexto direcional.
- Zonas de Velas Fonte HH/LL
-
- Desenha automaticamente zonas a partir das últimas velas fonte de Higher High e Lower Low.
- Três modos de zona:
-
- Vela Completa (máxima ↔ mínima)
- Apenas Corpo (intervalo de abertura/fechamento)
- Apenas Pavio (pavio superior para HH, pavio inferior para LL)
- Preenchimento da zona (pips), opacidade, cor para zonas longas/curtas e opção para estender zonas até a barra atual.
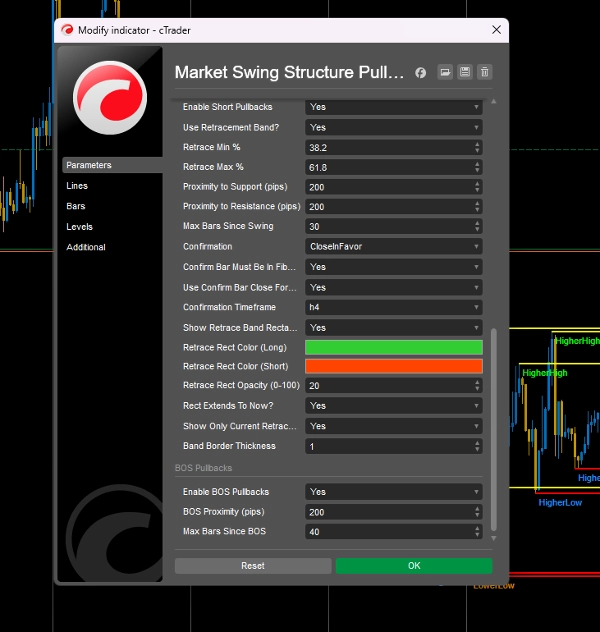
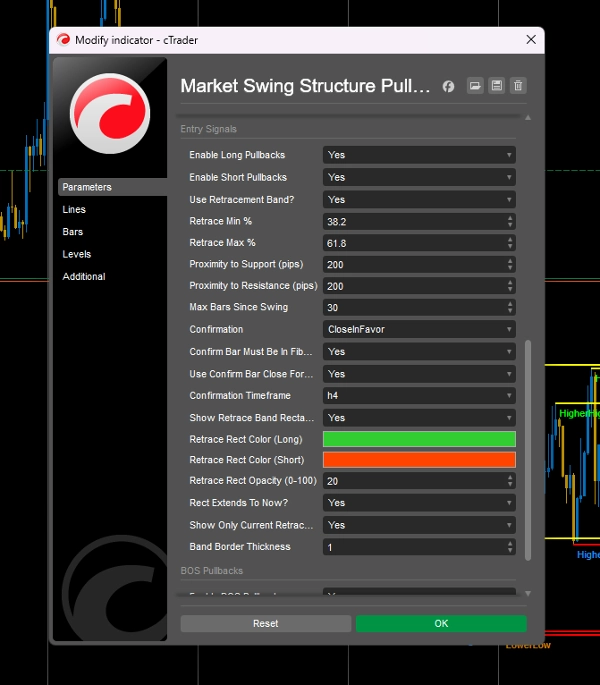
- Sinais de Entrada Inteligentes (opcional)
-
- Interruptor mestre para ligar/desligar todos os sinais de entrada.
- Entradas de pullback em oscilação:
-
- Usa a última perna de impulso (HH–HL ou LH–LL).
- Constrói uma faixa de retração no estilo Fibonacci (ex: 38,2–61,8%) para compras/vendas.
- Verifica proximidade com pontos de oscilação e níveis SR.
- Limita quantas barras após a oscilação um sinal ainda é válido.
- Pullbacks de Break-of-Structure (BOS):
-
- Detecta BOS através de quebras chave de LH/HL.
- Procura retestes do nível BOS e SR próximo.
- Usa filtros separados de proximidade e “barras desde BOS”.
- Mecanismo de Confirmação
-
- Múltiplos modos de confirmação para entradas:
-
- Fechamento apenas a favor
- Apenas vela engolfante
- Fechamento + Engolfante
- Nenhum (sinais brutos)
- Requisito opcional de que a vela de confirmação também deve estar dentro da faixa de retração.
- Timeframe de confirmação separado (ex: confirmar no H4 enquanto negocia no M15).
- Você pode escolher usar o fechamento da barra de confirmação como o preço/hora real do sinal.
- Controles Visuais e de Desempenho
-
- Deslocamentos ajustáveis de rótulos, tamanho da fonte e máximo de rótulos de estrutura.
- Opacidade do retângulo, espessura da borda e comportamento “estender até agora” para faixas de retração e zonas.
- Atualizações baseadas em temporizador para manter os cálculos eficientes mesmo em timeframes menores.
Ideal para
- Traders de price-action que dependem da estrutura do mercado (HH/HL/LH/LL).
- Traders swing e intraday que querem SR e linhas de tendência de timeframes maiores visíveis em seu gráfico de entrada.
- Traders que buscam entradas de pullback baseadas em regras em torno de estrutura chave, zonas e níveis BOS com confirmações claras.
Como usar
- Escolha seu timeframe SR (ex: H4) e intervalo de retrocesso.
- Ative Linhas de Tendência e ajuste se deseja que sejam estendidas e filtradas para gaps de fim de semana.
- Ative Estrutura do Mercado e rótulos para ver HH/HL/LH/LL e tendência/predição ao vivo.
- Ative Zonas e escolha seu modo de intervalo preferido (Completo, Corpo ou Apenas Pavio).
- Se quiser sinais, ative Sinais de Entrada, defina sua faixa de retração (ex: 38,2–61,8%), proximidades e comportamento de confirmação.
Você ainda controla sua gestão de risco e execução – Market Structure Pro oferece uma estrutura visual estruturada para que você possa focar na tomada de decisões, não no desenho.
Resumo
It features auto-drawn zones based on the last Higher High and Lower Low source candles, with options for full candle, body only, or wick-only ranges. Smart entry signals include swing pullback entries using Fibonacci-style retracement bands and break-of-structure (BOS) pullbacks, both filtered by proximity and time since the swing or BOS event. A confirmation engine supports multiple modes such as close-in-favor, engulfing candles, or combined confirmations, with configurable confirmation timeframes and signal price options.
Visual and performance controls allow adjustment of label offsets, font sizes, opacity, and update frequency to maintain chart clarity and efficiency. Market Structure Pro supports various markets including Forex, indices, commodities, stocks, and cryptocurrencies, and is suitable for price-action, swing, and intraday traders seeking structured, rule-based analysis and entry signals without manual drawing.
Avaliações de clientes
5 | 33 % | |
4 | 67 % | |
3 | 0 % | |
2 | 0 % | |
1 | 0 % |


![Logótipo de "[Stellar Strategies] Smart ADX"](https://cdn.ctrader.com/image/webp/af13b084-b6f6-41db-b7bc-c7e688b57b05_36929)


