
SMC
Wskaźnik
179 pobrania
Wersja 1.0, Feb 2026
Windows, Mac
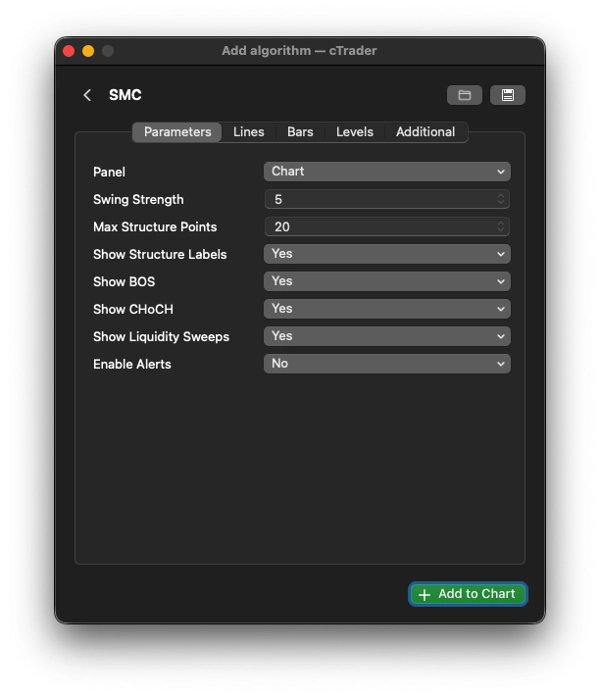
Podsumowanie głównej logiki – jak decyduje, co jest czym
- Wykrywa huśtawki za pomocą klasycznej logiki fraktalnej (słupki SwingStrength po lewej i prawej)
-
- Domyślnie = 5 → stosunkowo czyste huśtawki na większości ram czasowych
- Określa trend na podstawie ostatnich dwóch szczytów + ostatnich dwóch dołków:
-
- HH + HL → trend wzrostowy
- LH + LL → trend spadkowy
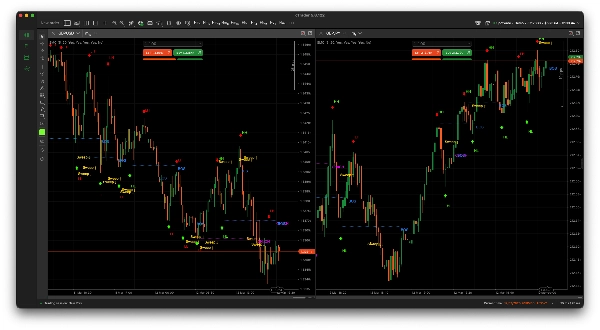
- Wykrywanie BOS / CHoCH (na zamknięciu):
-
- Zamknięcie > poprzedni szczyt huśtawki
-
- Jeśli trend był wzrostowy → BOS (kontynuacja)
- Jeśli trend był spadkowy → CHoCH (potencjalne odwrócenie)
- Zamknięcie < poprzedni dołek huśtawki → odwrotna logika
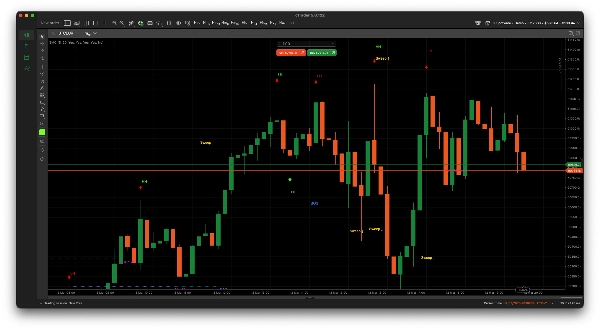
- Zamiecenie płynności (bardzo powszechny wzorzec SMC):
-
- Górny knot powyżej ostatniego szczytu huśtawki, ale zamknięcie poniżej niego → zamiecenie wzrostowe (prawdopodobne fałszywe wybicie w górę)
- Dolny knot poniżej ostatniego dołka huśtawki, ale zamknięcie powyżej niego → zamiecenie spadkowe
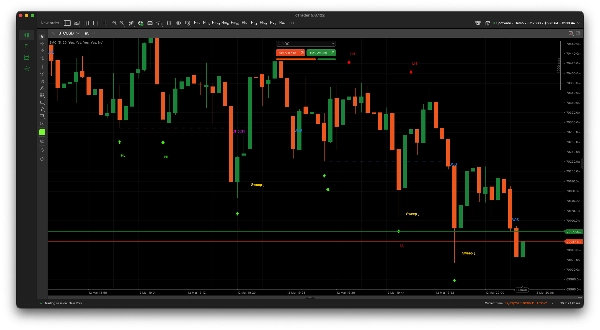
Typowe zastosowanie wskaźnika SMC w handlu
- Szukaj CHoCH + zamiecenia płynności w przeciwnym kierunku → wczesne sygnały odwrócenia
- Handluj w kierunku BOS po cofnięciu / zamieceniu
- Unikaj handlu przeciwko strukturze pokazanej przez oznaczenia HH/HL vs LH/LL
- Wielu traderów czeka na zamiecenie → sekwencje potwierdzające CHoCH/BOS
Profil wskaźnika
0.0
Opinie: 0
Opinie klientów
Ten produkt nie ma jeszcze opinii. Wypróbowałeś(-aś) go już? Bądź pierwszy(-a) i powiedz o tym innym!
BTCUSD
Forex
Breakout
Indices
EURUSD
Commodities
GBPUSD
NZDUSD
RSI
Prop
ZigZag
Scalping
Fair Value Gap
SMC
Crypto
Stocks
XAUUSD
NAS100
USDJPY
Produkty dostępne za pośrednictwem cTrader Store, w tym boty handlowe, wskaźniki i wtyczki, dostarczane są przez deweloperów zewnętrznych i udostępniane wyłącznie w celach informacyjnych oraz w celu zapewnienia dostępu technicznego. cTrader Store nie jest brokerem i nie zapewnia doradztwa inwestycyjnego, nie udziela spersonalizowanych rekomendacji ani nie gwarantuje przyszłych wyników.
Więcej od tego autora


Od 01/12/2025
179
Bezpłatne instalacje